Figures & data
Figure 1. Module Screenshots. (A) Sample screenshot from the bronchus review video. In this frame, the normal thickness for the submucosal glands was reviewed and the names of two conditions were provided that involve changes to the thickness. (B) Sample screen shot from a drag and drop review activity. The user was instructed to move eight specimen images into the corresponding boxes. (C) Answers to drag and drop review activity shown in (B). Histology images were obtained from the Virtual Microscopy Database under an Attribution-NonCommercial-ShareAlike 4.0 Creative Commons License (CC). Image (A) was edited to add arrows and percent
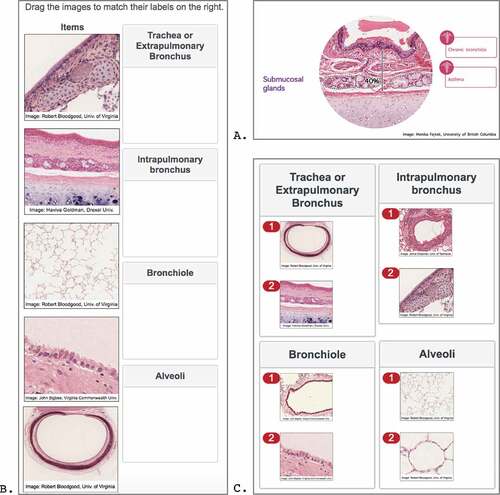
Figure 2. Study Timeline
Table 1. Pre-laboratory self-efficacy scores
Figure 3. Pathology Self-Efficacy versus General Self-Efficacy