
Figures & data
Table 1. Sampling distribution characteristics; 2020 good doctor survey.
Table 2. Sample selected characteristics (n = 1,000); 2020 good doctor survey.
Figure 1. Categories for ‘good’ doctors by 1000 Austrians: distribution of answers through the seven main categories.
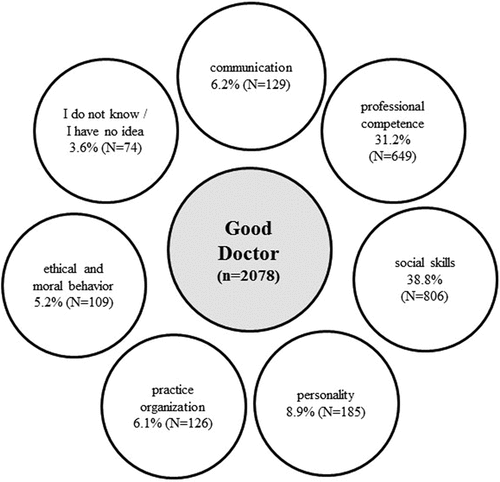
Figure 2. Categories for ‘bad’ doctors by 1000 Austrians: distribution of answers through the seven main categories.
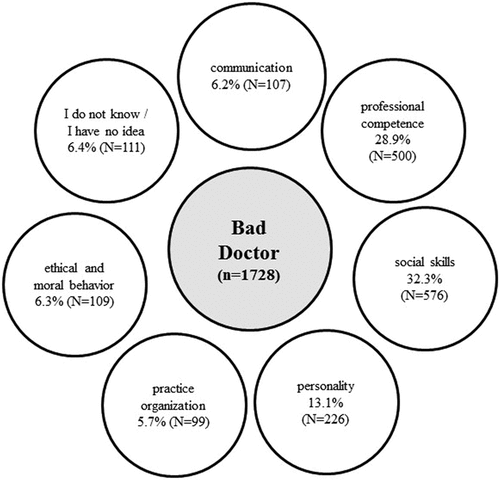
Table 3. Definition of the categories.
Table 4. Main categories and subthemes of ‘social skills’ for a good doctor.
Table 5. Main categories and subthemes of ‘professional competence’ for a good doctor.
Table 6. Main categories of ‘personality’ for a good doctor.
Table 7. Main categories and subthemes of ‘communication’ for a good doctor.
Table 8. Main categories and subthemes of ‘practice organization’ for a good doctor.
Table 9. Main categories and subthemes of ‘ethical and moral behavior’ for a good doctor.
Table 10. Main categories and subthemes of ‘social skills’ for a bad doctor.
Table 11. Main categories and subthemes of ‘professional competence’ for a bad doctor.
Table 12. Main categories of ‘personality’ for a bad doctor.
Table 13. Main categories and subthemes of ‘ethical and moral behavior’ for a bad doctor.
Table 14. Main categories and subthemes of ‘communication’ for a bad doctor.
Table 15. Main categories and subthemes of ‘practice organization’ for a bad doctor.