Figures & data
Table 1. RIPE Principles. Adapted from Kumar, 2021.
Figure 1. Chatbot architecture.
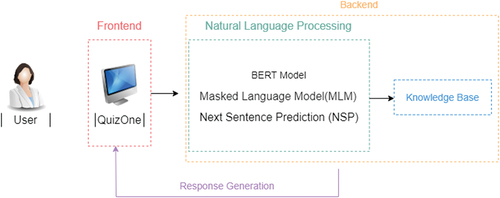
Table 2. Confusion Matrix.
Table 3. Performance Measures [Citation33,Citation34].
Table 4. Performance measures for Youden Index and Closest top-left distance cutoff values.
Table 5. Descriptive Statistics for cases.
Figure 2. ROC curves for each case.
Table 6. AUC and performance metrics per case.
Table 7. Frequency distribution of categories.
Figure 3. ROC curves for each category.
Table 8. AUC and performance metrics per category.
Table A1. Example of a history taking scheme focused on the symptom ‘leg pain’.