
Figures & data
Table 1. Respondent demographics, year of training, monthly salary, and household income.
Figure 1. Comparison of exposure to subspecialty training between male and female neurosurgical residents.
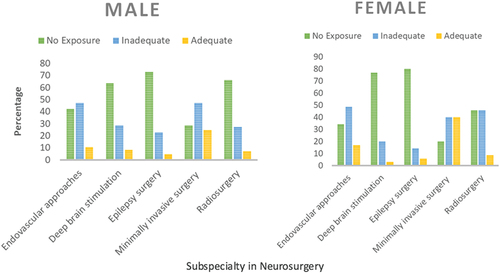
Table 2. Neurosurgery training program characteristics.
Table 3. Research experience and hands-on surgical exposure on the basis of gender.
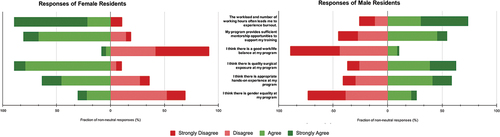
Figure 2. Depicts neurosurgery trainees’ perceptions, answered on a likert scale, to questions on working hours, mentorship, work life balance, surgical exposure, hands-on experience and gender equity.
Supplemental material
Supplementary File.docx
Download MS Word (25.8 KB)Data availability statement
All analyzed data relevant to the study are included in the. Raw data that support the findings of this study are available from the corresponding author, upon reasonable request.