Figures & data
Figure 1. Design of the altered auditory feedback task.
Table 1. Participant Characteristics and Descriptives for Performance During the Altered Auditory Feedback Task, Separately for the U.S. and Dutch Preliterate and Literate Children.
Figure 2. Adaptation response to altered auditory feedback split for preliterate and literate children; error bars represent ± 1 standard error of the mean.
Table 2. Correlations of the Reading Related-Measures With the Response to Altered Auditory Feedback.
Table 3. Correlations of the Reading Related-Measures With the Response to Altered Auditory Feedback.
Figure 3. Significant correlations between reading-related measures and response to altered feedback in the preliterate children. Note. Scores on the y-axis represent the relative adaptation score retrieved from the random effects structure from the linear mixed-effects model. The lower the score, the stronger the adaptation in response to altered feedback during the hold phase.
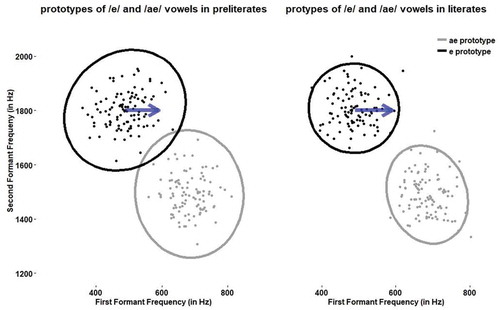
Figure 4. A proposal for what might happen in the vowel space as children become increasingly literate. Note. The vowel productions of the preliterate and literate children are simulated with the exact same parameters and variability. However, literate children might have built a narrower prototype of the involved vowels. With an equal alteration in auditory feedback (the arrow), this leads to perturbations that are close to the phoneme boundary in the literate children (hence, a stronger adaptation response) and further away from the boundary in the preliterate children (hence, a weaker adaptation response).