Figures & data
Table 1. Demographic characteristics of participants.
Figure 1. Visualization of misspellings for “assiduous” and “kaleidoscope” on target spelling task.
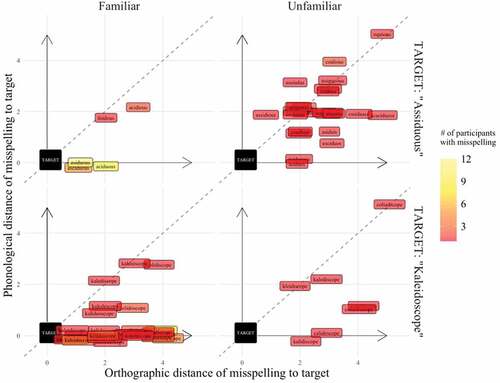
Table 2. Descriptive statistics and zero-order correlations of person & word-level features in the full sample (N = 61).
Table 3. Difficulty ranking by number of misspellings per target spelling word (N = 25).
Table 4. Fixed effects and variance estimates predicting probability of correct word spelling responses on target spelling task.
Table 5. Exploratory interaction effects predicting probability of correct word spelling responses on target spelling task.
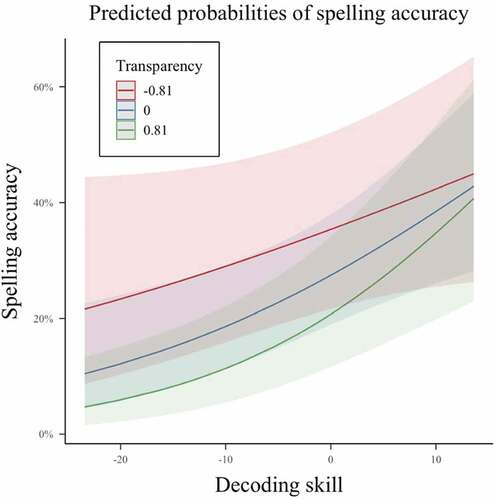
Figure 2. Interaction of total decoding score and spelling-to-pronunciation transparency rating in likelihood of accuracy on target spelling task.