Figures & data
Table 1. Description of word feature measures.
Figure 1. Overlap between word lists for unique words with complete data (n = 10,744 words).
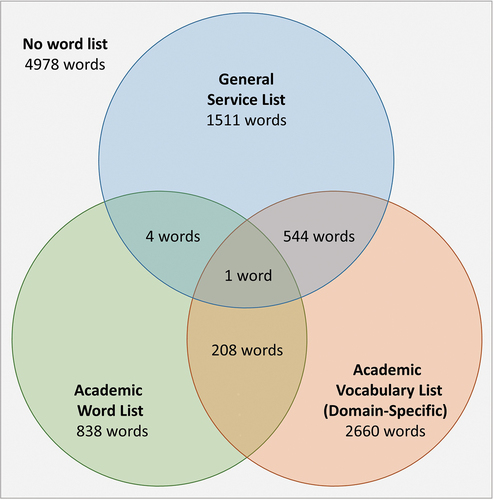
Table 2. Descriptive statistics for word features by word list.
Table 3. Factor analysis fit by word list reference.
Table 4. Factor loadings by Wordlist.
Figure 2. Factor correlations for the GSL-reference model estimated on each word sample. Note: Scatterplots below the diagonal contain random 200-word samples while density plots and correlations on and above the diagonal are based on entire word samples. Word samples include AVL_DS (red) Academic Vocabulary List Domain-Specific; AWL (green) Academic Word List; GSL (blue) General Service List; Words (purple) in any word list.
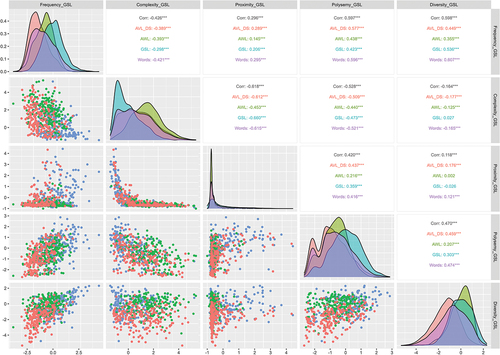
Figure 3. Factor correlations for the AWL-reference model estimated on each word sample. Note: Scatterplots below the diagonal contain random 200-word samples while density plots and correlations on and above the diagonal are based on entire word samples. Word samples include AVL_DS (red) Academic Vocabulary List Domain-Specific; AWL (green) Academic Word List; GSL (blue) General Service List; Words (purple) in any word list.
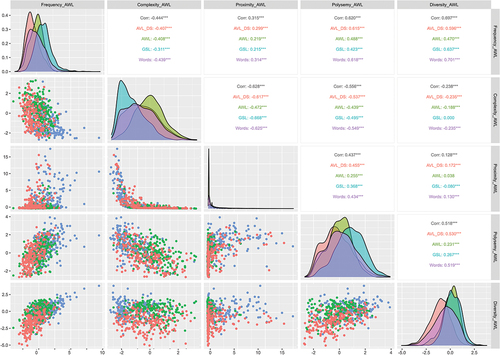
Figure 4. Factor correlations for the AVLDS-reference model estimated on each word sample. Note: Scatterplots below the diagonal contain random 200-word samples while density plots and correlations on and above the diagonal are based on entire word samples. Word samples include AVL_DS (red) Academic Vocabulary List Domain-Specific; AWL (green) Academic Word List; GSL (blue) General Service List; Words (purple) in any word list.
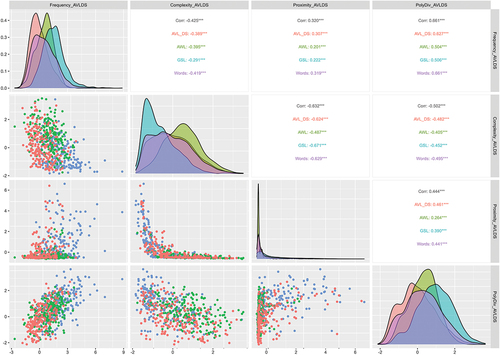
Table 5. Example words and factor estimates based on each model.
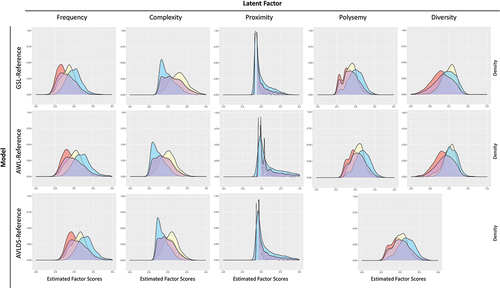
Figure 5. Scaled density plots by reference model and latent factor. Note: Word list samples are: GSL (blue) General Service List; AWL (yellow) Academic Word List; AVLDS (red) Academic Vocabulary List Domain-Specific; Words (purple) in any word list.