2,351
Views
0
CrossRef citations to date
0
Altmetric
Registered Report

Auditory Processing and Reading Disability: A Systematic Review and Meta-Analysis

ORCID Icon & ORCID Icon

Figures & data

Figure 1. PRISMA Diagram for the Present Review.

Figure 1. PRISMA Diagram for the Present Review.

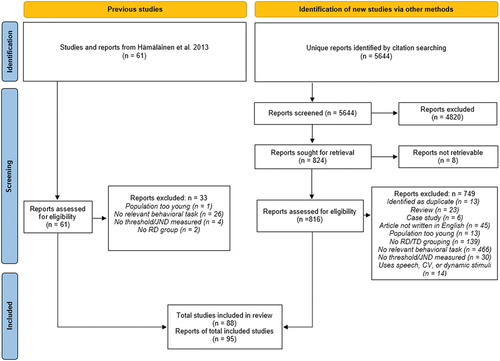
Table 1. A Priori Power Estimates from Known Extant Literature for Categorical Studies.

Figure 2a. Forest Plot of Frequency Discrimination Effect Sizes

Figure 2a. Forest Plot of Frequency Discrimination Effect Sizes

Figure 2b. Forest Plot of Frequency Discrimination Effect Sizes, Continued from Figure 2a.

Figure 2b. Forest Plot of Frequency Discrimination Effect Sizes, Continued from Figure 2a.

Figure 3. Forest plot of Duration Discrimination Effect Sizes.

Figure 3. Forest plot of Duration Discrimination Effect Sizes.

Figure 4. Forest Plot of Intensity Discrimination Effect Sizes.

Figure 4. Forest Plot of Intensity Discrimination Effect Sizes.

Figure 5. Forest Plot of Gap Detection Effect Sizes. Note. The 4I-2AFC used 4 stimuli and participants were told either stimulus 2 or 3 was different from the other 3.

Figure 5. Forest Plot of Gap Detection Effect Sizes. Note. The 4I-2AFC used 4 stimuli and participants were told either stimulus 2 or 3 was different from the other 3.

Table 2. Magnitude of Auditory Processing Impairments in RD: Intercept-only Models.

Table 3. Effects of Task Design: Meta-regression Models.

Table 4. Between- and Within-study Bias Analyses.

Supplemental material

Supplemental Material

Download MS Word (21.5 KB)

Supplemental Material

Download MS Word (15.9 KB)