
Figures & data
Figure 1. An illustration of the spatial EVS of the target word “ladder”.
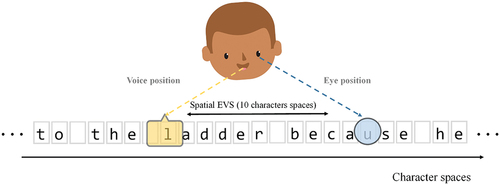
Table 1. Mean and Standard Deviation (in parenthesis) of Children’s standardized scores on off-line ability measures of participants by year group.
Figure 2. Example of the experimental sentences.
Table 2. Mean target word characteristics as a function of number of syllables and item set (SD in parenthesis).
Table 3. Mean and Standard Deviations (in parenthesis) for dependent measures across year group and number of syllables.
Figure 3. Bar plots showing means and ±1 SE for gaze duration, articulation duration and spatial EVS on target words by syllable number and year group.
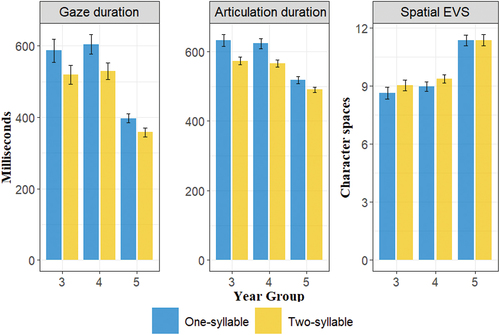
Table 4. LMM analyses showing gaze duration, articulation duration, and spatial EVS as a Function of year Group and number of syllables.
supplementary_file.docx
Download MS Word (62.2 KB)Data availability statement
The datasets generated and analyzed during the current study are available in the Open Science Framework (OSF) repository, https://osf.io/p2q45/?view_only=d64833a08f614cd5ad2423597aa725c6.