Figures & data
Figure 2. Interannual comparison (2002–2018) of the trafficability of the NWP and NSR for the two months period August 1 to September 30. The examined routes are marked as a red line. Trafficability was examined for any of the possible route options. Defined trafficability stages are ‘Closed with ice’ means that even a Polar Class 6 vessel could not traverse the passage. ‘Ice free’ means that retrospectively even a ship with no ice class could have made the traverse. ‘Intermediate stage’ would have required a Polar Class 6 ship for the traverse. Judgement of the trafficability stage was done on the basis of AMSR-2 sea-ice concentration data and MODIS optical images.
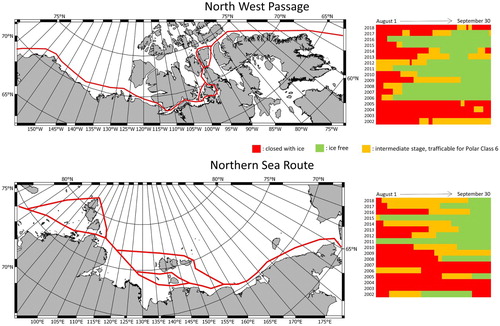
Table 1. Participating partners in European Space Agency (ESA), European Commission (EC), and consultancy reports specifying end-user needs for information provision to support maritime activities.
Table 2. Participating partners in workshop reports and unpublished surveys.
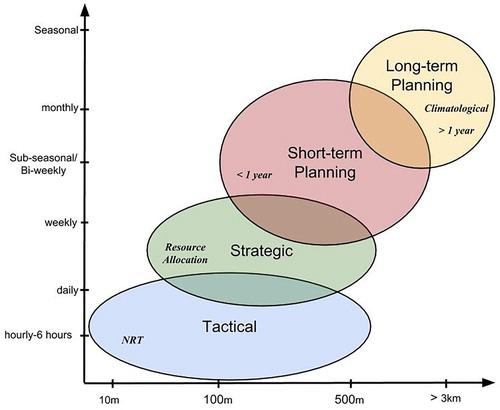
Figure 3. Schematic illustrating an example of the range of typical spatial and temporal scales of information required by users.