Figures & data
Figure 1. Uummannaq Fjord and the six communities examined in this study. Uummannaq (population 1255) is the largest community and serves as a regional hub. Background image is a Sentinel-2 NIR image from 19 March 2018. Inset shows the location of Uummannaq Fjord in western Greenland with the location of Sentinel-2 satellite image tiles marked with a red square.
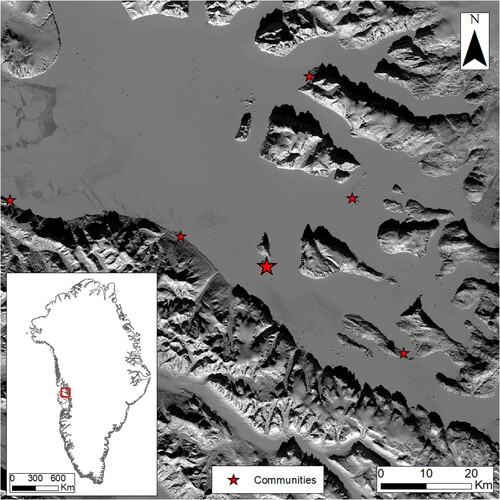
Figure 2. Snowmobiles and dogsleds are common modes of transportation on shorefast ice in Uummannaq Fjord. Here from April 2019. Credit: S.Cooley.
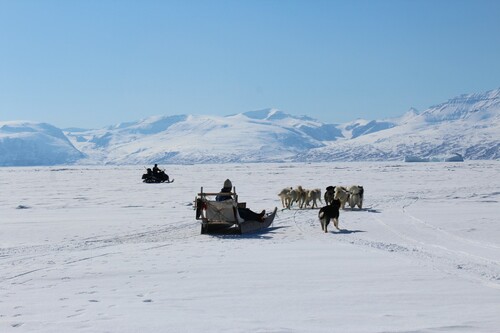
Figure 3. Sentinel-2 image of Uummannaq Fjord on 1 March 2017, displayed as (a) raw NIR band image; (b) classified surface types present in the fjord; (c) modeled cost-distance map illustrating how different surface types and distances influence travel cost between Uummannaq and surrounding communities; (d) optimal least-cost routes generated by the transportation model, showing cheapest (i.e. fastest) routes between Uummannaq and neighboring communities on 1 March 2017.
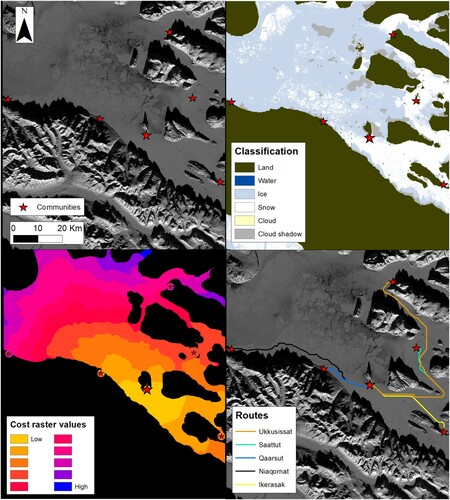
Figure 4. Box plots summarizing averaged optimal March travel routes for Period 1 (P1, 1988–1990), Period 2 (P2, 2000–2002), Period 3 (P3, 2014–2016), and Period 4 (P4, 2017–2019) for travel between Uummannaq and each of the other communities. (a) travel distance and (b) travel duration. Niaqornat lacks data in Period 3 due to lack of sufficient cloud free satellite imagery, and some scenes not covering this part of the fjord.
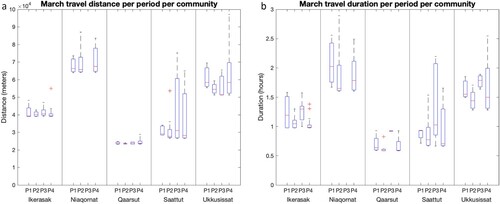
Figure 5. Same as , except for the month of April. (a) April travel distance (b) April travel duration.
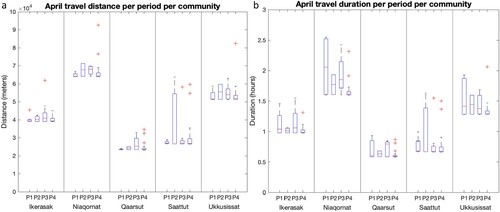
Figure 6. Same as , except for the month of May. (a) May travel distance and (b) May travel duration.
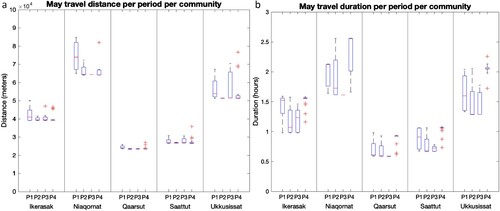
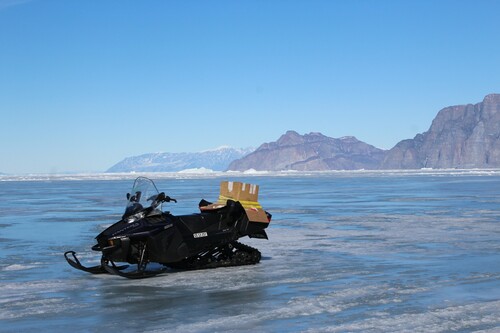
Figure 7. This snowmobile was incapacitated due to overheating on bare shorefast ice in Uummannaq Fjord, May 2019. Lack of snow cover increases difficulty of snowmobile travel over shorefast sea ice. Credit: S. Cooley.