Figures & data
Map 1. Location of the study area, including the ten districts where the majority of the questionnaire respondents live, and the research sites (numbered): 1) Novaia Chara, 2) Severobaykal’sk, 3) Tynda, 4) Ust’-Kut, 5) Baikalskoe, 6) Chapo-Ologo, 7) Chara, 8) Kholodnoe, 9) Nizhneangarsk, 10) Niya, 11) Pervomayskoe, 12) Tokma, 13) Ust’-Nyukzha, 14) Verkhnemarkovo, 15) Yuktali, 16) Zvezdniy, 17) Yakutsk, 18) Nizhniy Bestyakh, 19) Pavlovsk. Source: authors.
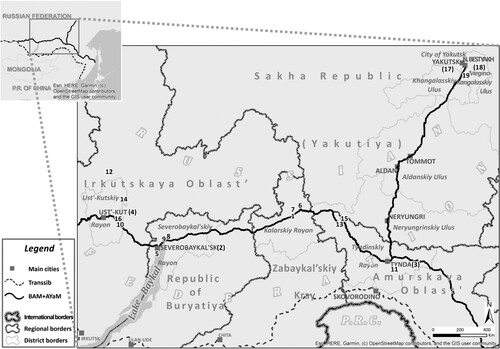
Table 1. Time periods for carrying out questionnaire survey in research sites.
Map 2. Locations of permanent residence of the survey respondents. Source: authors.
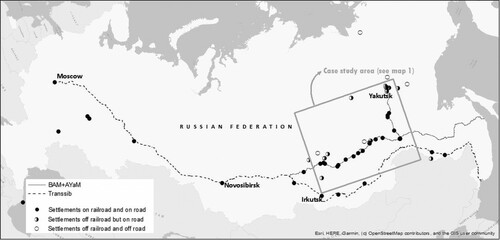
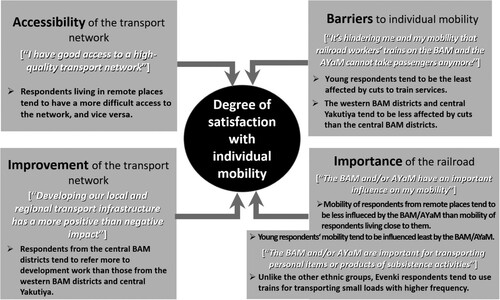
Figure 1. Summary of the main findings, focused on trends resulting from respondents’ level of agreement on questionnaire statements. Source: authors.
Map 3. Respondents’ levels of agreement about the statement relating to whether [future] development of the transport network would have a more positive than negative impact. Due to the low number of respondents, all districts in the Sakha Republic (Yakutiya) were merged into one value. Responses from other areas outside the BAM/AYaM region were not included. Source: authors.
![Map 3. Respondents’ levels of agreement about the statement relating to whether [future] development of the transport network would have a more positive than negative impact. Due to the low number of respondents, all districts in the Sakha Republic (Yakutiya) were merged into one value. Responses from other areas outside the BAM/AYaM region were not included. Source: authors.](/cms/asset/3a565347-987b-4d8e-b9e7-f2cc0a019c2b/tpog_a_2046195_f0004_ob.jpg)
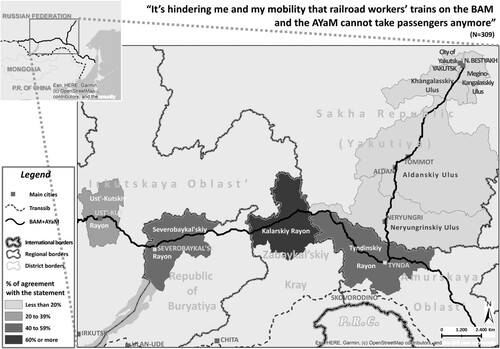
Map 4. Respondents’ levels of agreement about barriers to individual mobility based on the circumstances that railroad workers’ trains do not take passengers anymore. Due to the low number of respondents, all districts in the Sakha Republic (Yakutiya) were merged into one value. Responses from other areas outside the BAM/AYaM region were not included. Source: authors.