
Figures & data
Figure 1. Schematic of the “Reef Survivor” board game and associated material, i.e., game boards (environment player boards, nursery, and coral triangle), organism tokens (reef builders, dwellers, and coverers), mutation tokens, and disaster cards. Note: game pieces, boards, and cards not shown to scale.
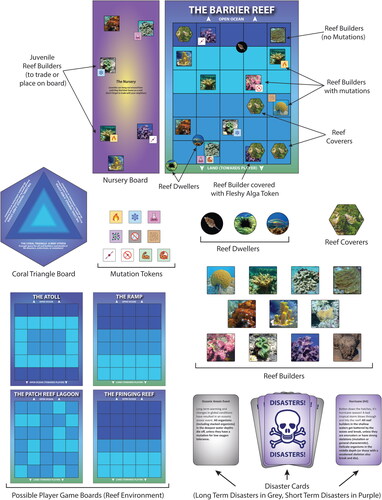
Table 1. Student Learning Objectives (SLOs) associated with the “Reef Survivor” board game.
Figure 2. Demographic breakdown of the participants that responded to the demographic survey (number of participants that responded listed on the right). Note that some categories were amalgamated to preserve student anonymity and privacy without the intent to erase unique identities. School Type: 78% public 4-year university, 7% private 4-year university (Private Uni.), and 15% liberal arts college. Major: 59% geoscience major (e.g., geology, geophysics, Earth sciences), 32% STEM (Science, Technology, Engineering, or Math) major, with about half identifying specifically as bioscience majors (not all surveyed has bioscience as an option), 5% non-STEM (e.g., history, social work, art), and 3% undeclared (UD). College Year: 32% Freshmen (first year), 14% Sophomore (second year), 15% Junior (third year), 32% Senior+ (fourth year or higher), and 7% graduate students (Grads). Gender: 42% male students, 51% female students, 6% Transgender, non-binary students, and Genderqueer (T, NB, or GQ), 2% preferred not to say. Note: some individuals selected multiple categories. LGBTQ + Status: 25% identify as LGBTQ+ (lesbian, gay, bisexual, transgender, queer, and others), 71% did not, and 4% preferred not to say or marked “other”. Ability: 81% do not have a disability, 11% have a disability, and 8% prefer not to say. Income or Social Economic Status (SES): 4% high, 29% upper-middle, 33% middle, 20% lower-middle, 9% lower, and 4% prefer not to say.
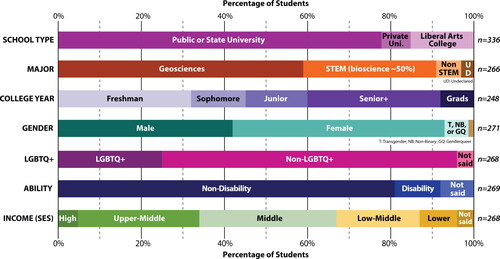
Figure 3. Race and ethnicity information from the participants that responded to the demographic survey (259 responses of 348 total participants). (A) Percentage of participants that are a given race or ethnicity (selected from a list of options); some race and ethnicity data were amalgamated to preserve student anonymity and privacy without the intent to erase unique identities. (B) The ethnic and racial identities of participants (open ended question).
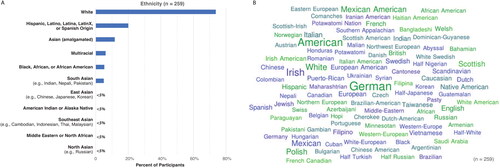
Figure 4. Notebooks used as part of the board game.
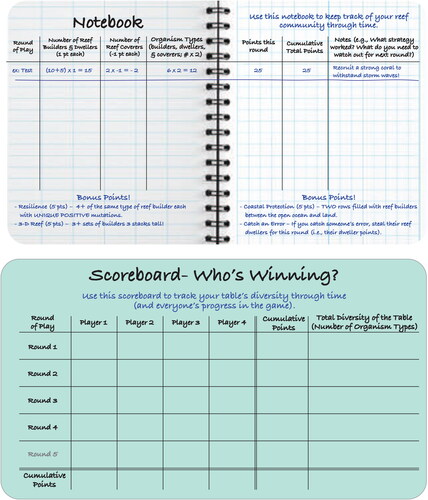
Figure 5. Stacked bar charts of participant survey data with a focus on their opinions about the “Reef Survivor” as an educational board game (256 student responses unless otherwise noted).
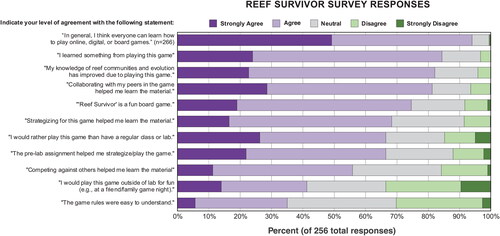
Table 2. Assessment questions for the “Reef Survivor” board game and their corresponding Student Learning Objectives (SLOs).
Figure 6. Stacked bar charts of participant survey data with a focus on their experience with games and how “Reef Survivor” played in their course (number of student responses noted next to each question).
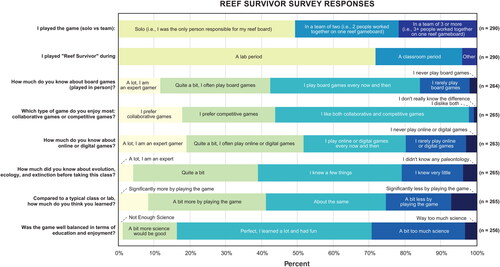
Figure 7. Time it took the surveyed participants to complete “Reef Survivor” (249 student responses).
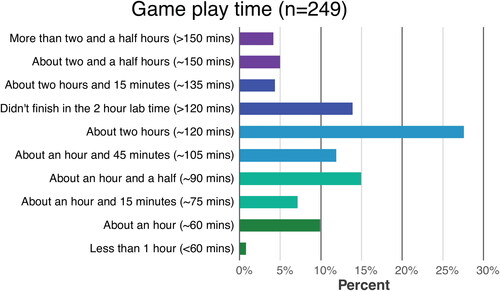
Table 3. Positive comments about the game and educational gains from the survey, see supplemental material (S4) for a complete list of student comments.
Table 4. Specific comments about components of gameplay from the survey, see supplemental material (S4) for a complete list of student comments.
Table 5. Negative comments about the game from the survey, see supplemental material (S4) for a complete list of student comments.
Figure 8. Multivariate regression models of participant learning gains (i.e., the sum of post-lab scores minus pre-lab scores) and their relation to the semester and demographics (185 total complete responses). Confidence intervals (95%) are plotted to show overall gains from gaming and for comparison. Blue values include all data, whereas the red values indicate data split by semester.
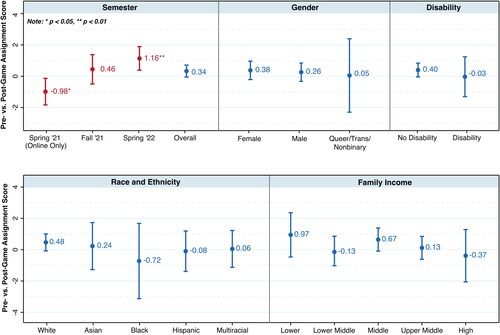
Table 6. Suggested improvements for the game or associated activities, see supplemental material (S4) for a complete list of student comments.