Figures & data
Table 1. Summary of participant numbers in field courses, by Native/Non-Native and Gender.
Table 2. Summary of participant numbers in field courses by grade level completed.
Table 3. Five-day schedule 2017.
Table 4. Ten-day schedule 2018.
Table 5. Five-day schedule 2019.
Figure 1. Frequency table of student responses (Strongly Disagree, Disagree, Neutral, Agree or Strongly Agree) with survey statements.
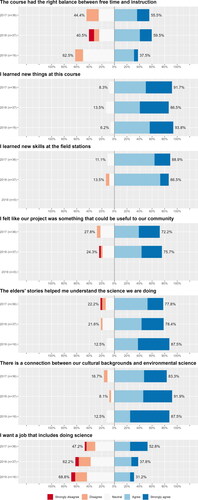
Table 6. Coded responses to the question “What was your favorite part about the course”.
Table 7. Coded answers to the open-ended question “What was your favorite field station?”.
Table 8. Coded responses to the open-ended question “What did you like least about the course?”.
Figure 2. Frequency table of student responses (Yes or No) to survey questions.
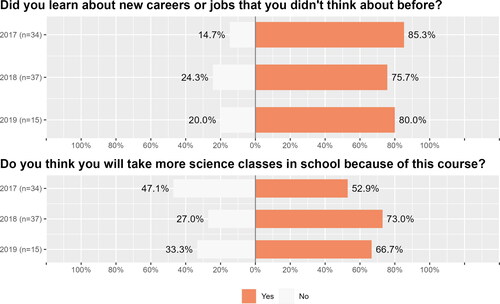
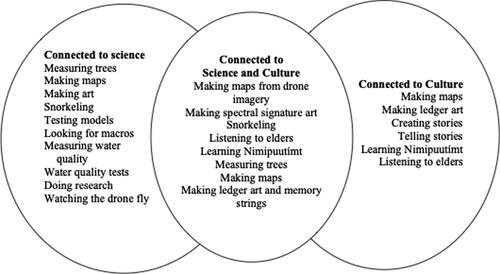
Figure 3. Compiled Card Sort data.