
Figures & data
Figure 1. PRISMA flow diagram for PICO#4 PROSPERO 2016: CRD42016040107.
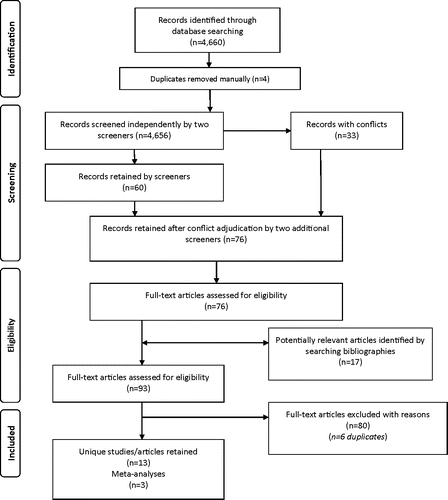
Table 1. Detailed information regarding napping intervention in retained studies
Table 2. Synthesis of findings of individual studies comparing Napping/Sleeping during shift work to No Napping/Sleeping during shift work in relation to outcomes rated critical or important
Figure 2. Figure 2a-2d: Forest Plots (2a: outcome: reaction time at end of shift by nap vs. no-nap), (2b: outcome: delta/change in reaction time from start-to-end of shift within condition [nap vs. no-nap]), (2c: outcome: difference in sleepiness at end of shift by nap vs. no-nap), (2d: outcome: delta/change in sleepiness from start-to-end of shift within condition [nap vs. no-nap]). Notes: The aforementioned figures report the standardized mean difference (SMD) for reaction time and acute fatigue (using sleepiness measures) for the control compared to the intervention (mean outcome under the control condition minus the mean outcome under the nap condition). The SMD is the estimated intervention effect of each study relative to the variability in the study and also known as Cohen's d measurement of effect size. The effect size is not tied to a specific scale or scales used in the pooled analysis. An SMD of zero implies the intervention and control condition (placebo) are equal. An SMD greater than zero indicates that the napping group had a lower mean value than the control group (treatment condition leads to better/faster reaction time and lower sleepiness). Common delineations or cut-points for interpretation include: 0.2 = small; 0.5 = medium/moderate; 0.8 or greater as large. The SMD is non-significant if the corresponding 95% confidence interval is wide and overlaps 0. RevMan software (V.5.3) was used to generate SMDs for reaction time and sleepiness and for producing forest plots. For the Purnell et al. study, reaction time data (means and standard errors) were abstracted from of the manuscript for the start and end of the 1st shift for both the control condition and the nap condition (Citation29). The use of data from the 1st shift was appropriate as the participants would be more naïve to the intervention compared to the participants in the 2nd shift. Signal and colleagues generated reaction time with use of the 10-minute psychomotor vigilance test (PVT) (Citation31). Raw means and SDs were not reported in the manuscript. These data were obtained from Signal upon request specific to the “early night shift” start of shift and end of shift PVT measures (Citation31). Data for reaction time (means and SDs) for the Sallinen et al. study were abstracted from of the manuscript specific to the early 30 arm (Citation27). Data from these three studies was combined and the specific study arms from each study given the similarities in timing of the napping intervention and nap duration across studies. The studies all used crossover designs with each participant having measurements during intervention and control periods. For purposes of , the difference in mean reaction time taken at the end of the shift between the control condition and nap condition was calculated. When standard deviations (SDs) were not provided, the study used the following formula to generate SDs [SD = SE * SQRT(N)]. The standard deviation with person difference between the intervention and control periods was calculated assuming the correlation within person was 0.5 (SD for the difference = √(SD2 intervention + SD2 control −2*0.5*SDintervention*SDcontrol). shows the calculation of the change (delta) in reaction time from the start-to-end of shift within each condition (the nap and no-nap groups). The difference in the change was then calculated by subtracting the intervention change from the control condition change. The SD for the within shift change were approximated assuming the correlation within shift for the same individual was 0.5 (SD for the within shift change = √(SD2 before shift + SD2 after shift −2*0.5*SDbefore shift*SDafter shift). This study applied the same approach when calculating the SD for the control versus intervention changes due the crossover nature of the study designs (SD for the difference in deltas = √(SD2 intervention within shift delta + SD2 control within shift delta −2*0.5*SDintervention within shift delta*SDcontrol within shift delta). shows the abstracted data from Sallinen et al. and Purnell et al. (Citation27, 29). For the Purnell et al. study, the current research abstracted data from , for the measurement of subjective ratings of sleepiness measured with a visual analog scale (scored 0–100), where higher scores indicate worsening sleepiness (Citation29). For the Sallinen et al. study, the current research abstracted data from , where authors reported results of the Karolinska Sleepiness Scale (KSS), with scores ranging from 1–9 where higher scores imply worsening sleepiness (Citation27). For purposes of , this study used the aforementioned calculation for the delta/change within sleepiness from start to end of shift by nap vs. no-nap condition.
![Figure 2. Figure 2a-2d: Forest Plots (2a: outcome: reaction time at end of shift by nap vs. no-nap), (2b: outcome: delta/change in reaction time from start-to-end of shift within condition [nap vs. no-nap]), (2c: outcome: difference in sleepiness at end of shift by nap vs. no-nap), (2d: outcome: delta/change in sleepiness from start-to-end of shift within condition [nap vs. no-nap]). Notes: The aforementioned figures report the standardized mean difference (SMD) for reaction time and acute fatigue (using sleepiness measures) for the control compared to the intervention (mean outcome under the control condition minus the mean outcome under the nap condition). The SMD is the estimated intervention effect of each study relative to the variability in the study and also known as Cohen's d measurement of effect size. The effect size is not tied to a specific scale or scales used in the pooled analysis. An SMD of zero implies the intervention and control condition (placebo) are equal. An SMD greater than zero indicates that the napping group had a lower mean value than the control group (treatment condition leads to better/faster reaction time and lower sleepiness). Common delineations or cut-points for interpretation include: 0.2 = small; 0.5 = medium/moderate; 0.8 or greater as large. The SMD is non-significant if the corresponding 95% confidence interval is wide and overlaps 0. RevMan software (V.5.3) was used to generate SMDs for reaction time and sleepiness and for producing forest plots. For the Purnell et al. study, reaction time data (means and standard errors) were abstracted from Table 1 of the manuscript for the start and end of the 1st shift for both the control condition and the nap condition (Citation29). The use of data from the 1st shift was appropriate as the participants would be more naïve to the intervention compared to the participants in the 2nd shift. Signal and colleagues generated reaction time with use of the 10-minute psychomotor vigilance test (PVT) (Citation31). Raw means and SDs were not reported in the manuscript. These data were obtained from Signal upon request specific to the “early night shift” start of shift and end of shift PVT measures (Citation31). Data for reaction time (means and SDs) for the Sallinen et al. study were abstracted from Table 2 of the manuscript specific to the early 30 arm (Citation27). Data from these three studies was combined and the specific study arms from each study given the similarities in timing of the napping intervention and nap duration across studies. The studies all used crossover designs with each participant having measurements during intervention and control periods. For purposes of Figure 2a, the difference in mean reaction time taken at the end of the shift between the control condition and nap condition was calculated. When standard deviations (SDs) were not provided, the study used the following formula to generate SDs [SD = SE * SQRT(N)]. The standard deviation with person difference between the intervention and control periods was calculated assuming the correlation within person was 0.5 (SD for the difference = √(SD2 intervention + SD2 control −2*0.5*SDintervention*SDcontrol). Figure 2b shows the calculation of the change (delta) in reaction time from the start-to-end of shift within each condition (the nap and no-nap groups). The difference in the change was then calculated by subtracting the intervention change from the control condition change. The SD for the within shift change were approximated assuming the correlation within shift for the same individual was 0.5 (SD for the within shift change = √(SD2 before shift + SD2 after shift −2*0.5*SDbefore shift*SDafter shift). This study applied the same approach when calculating the SD for the control versus intervention changes due the crossover nature of the study designs (SD for the difference in deltas = √(SD2 intervention within shift delta + SD2 control within shift delta −2*0.5*SDintervention within shift delta*SDcontrol within shift delta). Figure 2c shows the abstracted data from Sallinen et al. and Purnell et al. (Citation27, 29). For the Purnell et al. study, the current research abstracted data from Table 1, for the measurement of subjective ratings of sleepiness measured with a visual analog scale (scored 0–100), where higher scores indicate worsening sleepiness (Citation29). For the Sallinen et al. study, the current research abstracted data from Table 2, where authors reported results of the Karolinska Sleepiness Scale (KSS), with scores ranging from 1–9 where higher scores imply worsening sleepiness (Citation27). For purposes of Figure 2d, this study used the aforementioned calculation for the delta/change within sleepiness from start to end of shift by nap vs. no-nap condition.](/cms/asset/3816b9d2-f721-4401-9c12-80e8659f7b04/ipec_a_1376136_f0002_oc.gif)