
Figures & data
Figure 1. A map of the Province of Modena (Italy). The area marked in red was more severely damaged by the seismic sequence of 2012. Arrows show the reorganization of the hospital system during the catastrophe. © Alberto Barbieri. Reproduced by permission of Alberto Barbieri. Permission to reuse must be obtained from the rightsholder.
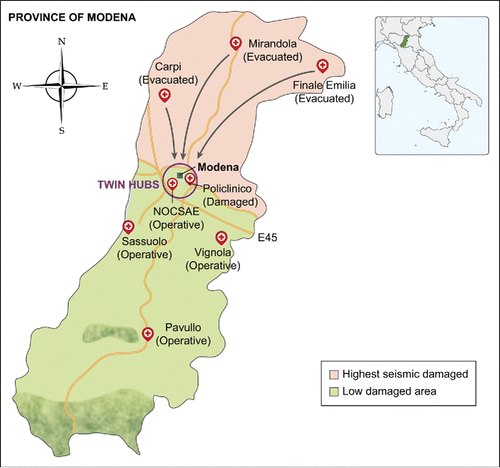
Figure 2. Enrollment flow chart: Inclusion and exclusion criteria.
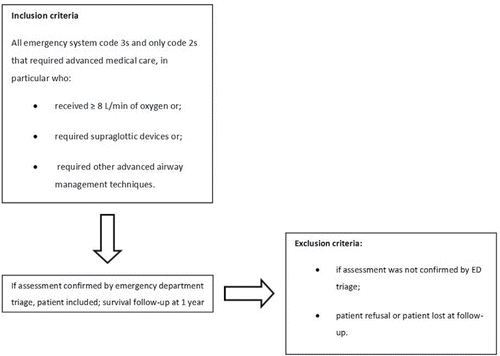
Figure 3. Temporal succession of phases and stages of the study. Phases: Pre-earthquake – from January 1, 2011 to May 19, 2012 – (phase 0), Earthquake – May 20 – May 29, 2012 – (phase 1), Immediate aftermath – June and July 2012 – (phase 2), Early reorganization – from August to October 2012 – (phase 3), Normalization – from November 2012 to December 2013 (phase 4); Stages: Pre-earthquake (0) – from January 1, 2011 to May 19, 2012 – (it includes phase 0), Earthquake (1) – from May 20 to November 3, 2012, when the Italian Red Cross declared the earthquake emergency over (it includes phase 1, 2 and 3), Post-earthquake (2) – from November 4, 2012, to December 31, 2013 (it includes phase 4).
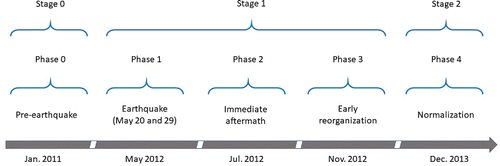
Table 1. Referral rates for status codes 2 and 3 to Nuovo Ospedale S. Agostino Estense (NOCSAE) and Policlinico hub hospitals from January 2011 to December 2013.
Table 2. Case mix of admissions by stage: before the earthquake 0, during the earthquake 1, after the earthquake 2.
Figure 4. Kaplan–Meier survival estimate curves for survival before, during, and after the earthquake emergency (stages 0, 1, and 2, respectively). Figure reports hazard ratios and p-values.
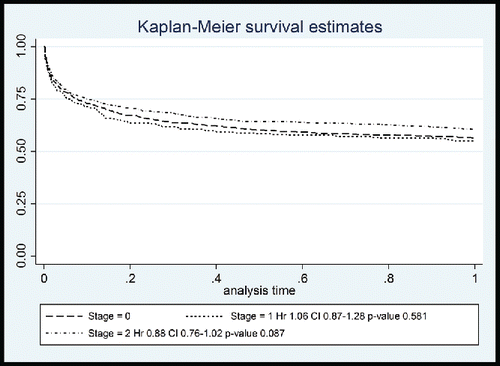
Table 3. Percentages of code 2 and 3 patients taken to each hospital before and after the earthquake.
Table 4. Ambulance referral times (ES) and emergency department treatment times (ED) in each hub hospital during the phases of the earthquake emergency including first line life-saving treatments and diagnostic procedures.