Figures & data
Table 1. Descriptive analysis of patients who received a short on-scene time (<20 min), or long on-scene time (>20 min)
Figure 1. A forest plot showing the independent effects on on-scene time of demographic factors, injury severity, situational factors, and interventions given. The estimates can be interpreted as follows: this factor increases or decreases the on-scene time by x minutes, independent of the other factors displayed. This is the result of a multivariable mixed effects linear regression model with a random intercept for center conditional on country. The coefficients (and 95% confidence intervals) of the model are displayed. The partial R2 displayed is the percentage of the full model attributable to between country differences. RTI, Road traffic incident; MEI, major extracranial injury; GCS, Glasgow Coma Scale; IQR, interquartile range; CPR, cardiopulmonary resuscitation; IV, intravenous.
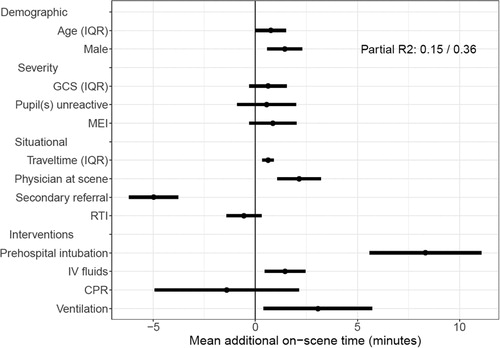
Table 2. The number and percentage of patients with hypotension or hypoxia at arrival at the ED
Figure 2. The effect of demographic factors, injury severity, situational factors, and interventions given on hypotension (systolic blood pressure < 100 mmHg) or hypoxia (oxygen saturation < 90%) at arrival at the emergency department. The effects are based on a logistic multivariable regression model.
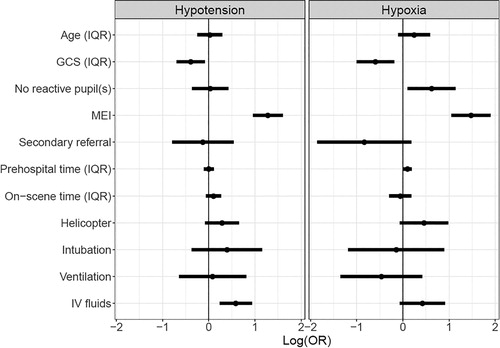
Figure 3. Bar charts showing the time spent in different prehospital phases per country (upper row), and the percentage of prehospital interventions (second row) used. In the upper row, only bars based on more than 10 patients are displayed.
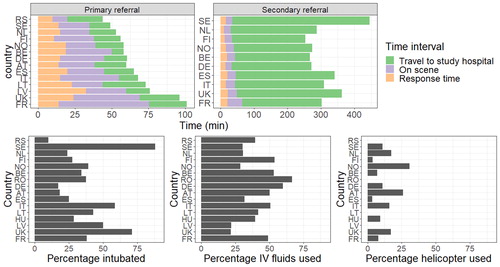
Figure 4. The adjusted variation in prehospital time (upper row), and use of key prehospital interventions (bottom row) across Europe. Every map shows the deviation per country from the overall average. In the upper row, the mean of the median time per country is shown. Moreover, secondarily referred patients are excluded from the analysis of travel times, because the time until arrival in the secondary hospital is unknown. The estimates of the random intercepts for each country are displayed. These are adjusted for the IMPACT core variables (age, pupils, and GCS), the CENTER-TBI stratum in which the patient was included, and the random variation at the center level.
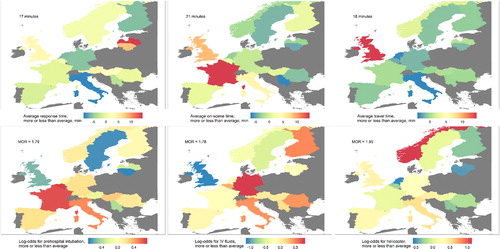
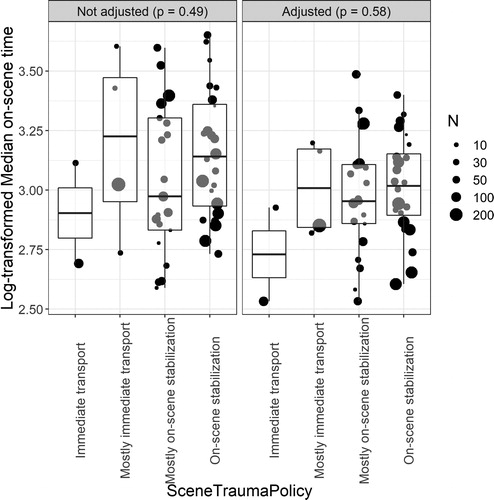
Figure 5. The unadjusted and adjusted log transformed median on-scene times. The bubbles represent the random intercept value for the model predicting on-scene time with center as random intercept. The right panel shows log transformed median on-scene times adjusted for GCS, traveltime, intubation, pupils, and sex (which were identified drivers of on-scene time).