
Figures & data
Figure 1. Number of events managed by the EMS in March and April 2019 and 2020. Panel A reports the number of events managed by the dispatch center, the number of “Breathing” or “Infective” events and the number of patients transported to hospital. Panel B reports the number of patients not transported to hospital and the number of patients died. *: p < 0.0001; #: p = 0.054.
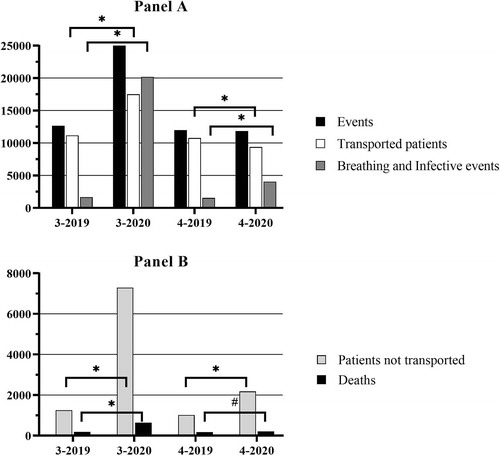
Table 1. Waiting time for ambulance in hospital
Table 2. Severity at admission into emergency department
Table 3. Characteristics of the patients
Supplemental material