
Figures & data
Figure 1. Heart icon represents the geographical position of the reported emergency. Gray icons with white stickman represent first responders in a mission. Black stickman represents the patient. Three circles are drawn with radii of 100, 50, and 10 meters around the emergency location. A GPS position within the respective circle results in logging the first responder as “arrived.”
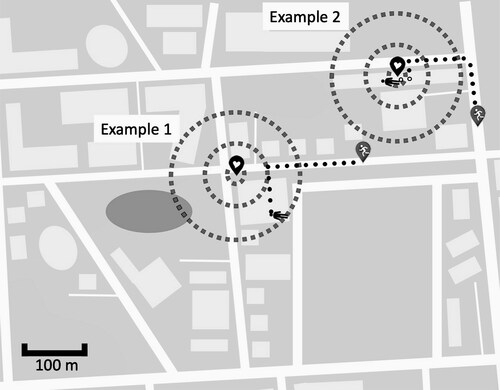
Figure 2. Flow diagram of the cases included in the study.
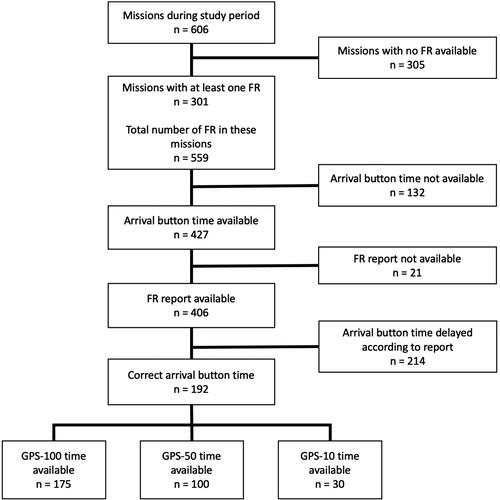
Figure 3. Bland-Altmann plots for the response times of first responders. Each value represents the real arrival time (manual confirmation) and the time at which the first responder’s position was logged within the circle with a radius of 100 (a), 50 (b), or 10 (c) meters around the geographical position of the reported emergency. The outer dashed lines represent the 95% confidence interval of the mean of all measurements, which is marked by the middle-dashed line.
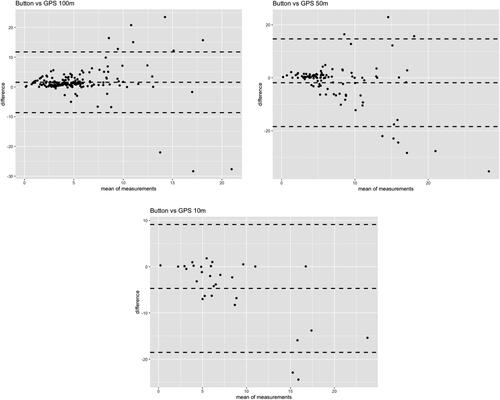
Table 1. GPS-based logging versus manual confirmation of arrival times.
