
Figures & data
Figure 1. Fatality rate for all causes of traumatic brain injury (TBI). Source: Brown et al. (Citation3); Used with permission.
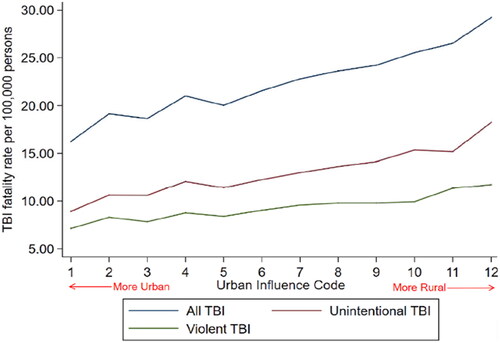
Figure 2. Rural vs. urban traumatic brain injury (TBI) fatality rates. Dark red areas indicate higher age-adjusted fatality rates from TBI. Black-lined areas indicate rural regions. Source: Brown et al. (Citation3). Used with permission.
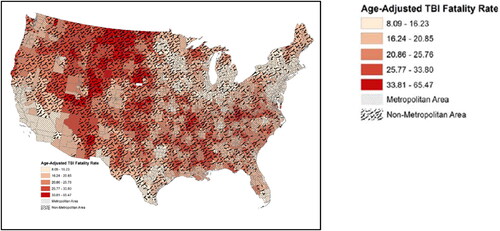
Table 1. Categories and topics included in this update.
Table 2. Comparison of Pediatric GCS with GCS.
Figure 3. Stepwise execution of prehospital decision-making in the care of a patient with head injury.
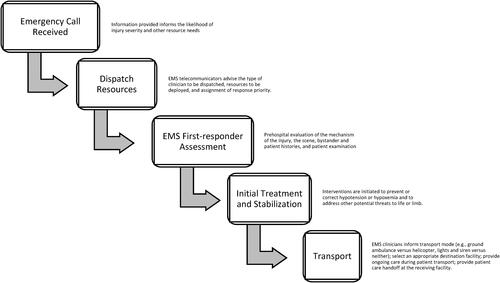
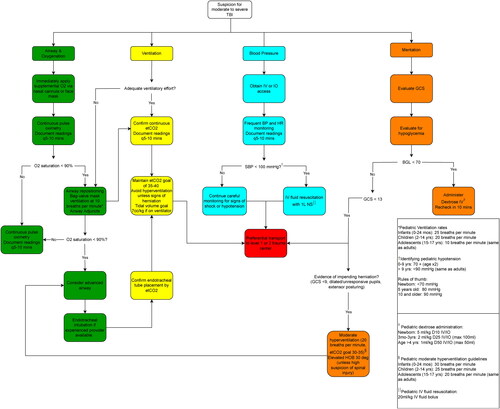
Figure 4. Prehospital algorithm for evaluation and management of patients with suspicion for moderate to severe TBI.
Supplemental material