Figures & data
Table 1. Times for 2011 (constant) and significance of slope of competition year, positions by event and gender. Mean percentage difference (2019 vs. 2011) included for each event and performance category
Table 2. Age-adjusted mean Men’s times for 2011–2019 (by event and performance category) and predicted times (95% CI) for 2024 based on the available pooled data
Table 3. Age-adjusted mean Women’s times for 2011–2019 (by event and performance category) and predicted times (95% CI) for 2024 based on the available pooled data
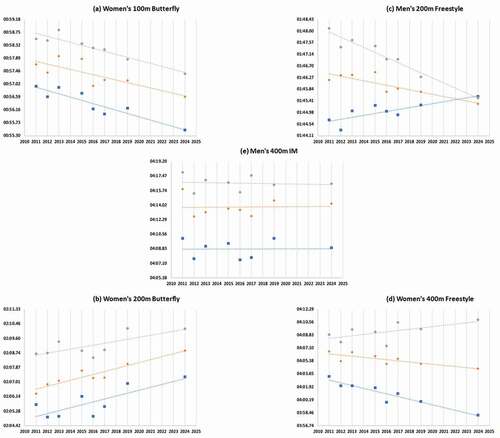
Figure 1. Figure 1. Five broad groups for predicted times in 2024; a) all performance categories improving (e.g., Women’s 100 m Fly); b) all performance categories declining (e.g., Women’s 200 m Fly); c) performance categories converging (e.g., Men’s 200 m Free); d) performance categories diverging (e.g., Women’s 400 m Free); and e) all performance categories staying stable (e.g., Men’s 400 m IM). Data points are age-adjusted mean times for 2011–2019, with the 2024 data point being the predicted time. Linear trend lines have been added for ease of interpretation. (Rank 1st-3rd = Squares, Rank 4th-8th = Diamonds; Rank 9th-16th = Circles).