Figures & data
Table 1. Descriptive statistics (M ± SD) for validation sample, cross-validation sample, and total sample.
Table 2. Zero-order correlations between measured peak vertical jump power (W) and predictor variables for validation sample, cross-validation sample, and total sample.
Table 3. Zero-order correlations among predictor variables for total sample.
Figure 1. Scatterplot between measured vertical jump power and vertical jump height.
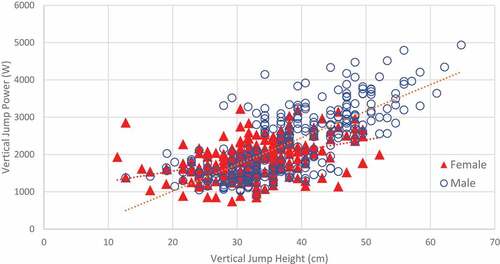
Figure 2. Scatterplot between measured vertical jump power and estimated vertical jump power for the recommended model for the total sample.
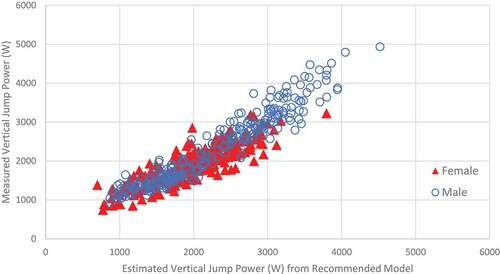
Table 4. Multiple regression models to estimate peak vertical jump power (W).
Table 5. Cross-validation analysis of regression models developed on validation sample on cross-validation sample.
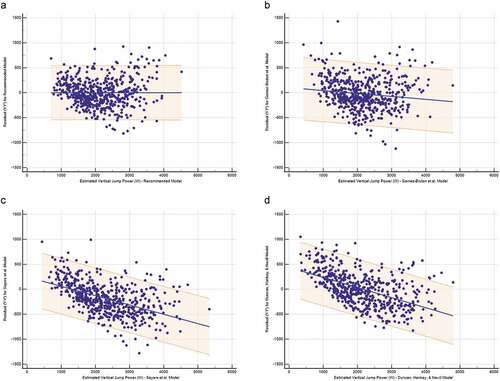
Figure 3. Residual plots for regression models. a. Residual plot for model developed in current study from validation sample. b. Residual plot for Gomez-Bruton et al. (Citation2019) model. c. Residual plot for Sayers et al. (Citation1999) model. d. Residual plot for Duncan, Hankey, and Nevill (Citation2013) model.