Figures & data
FIGURE 1. Largest Defined Benefit Pension Markets (Market Size Estimated in USD tn). Source: Willis Towers Watson 2019 Global Pension Asset Study. U.S. data from Investment Company Institute as of Dec. 31, 2018. U.K. data from PPF, estimated in USD as of March 31, 2018. Nordics data from OECD as of 2015.
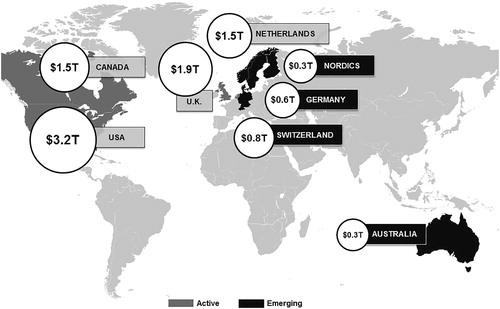
FIGURE 2. Global Market for Insured Annuities (Market Size Estimated in USD bn). Sources: USA: Morningstar, Inc. and Insured Retirement Institute, total variable annuity net assets, 2016; UK: SynThesys Life, from FSA returns, net reserves, 2008 data; Canada: CLHIA, 2016; Chile: World Bank, 2014, estimates; Spain: ICEA, 2016; South Africa: FSB, ASISA, 2017, estimates; Australia: Strategic Insight, lifetime annuity assets, 2017. Note: It proved to be very difficult to get reliable estimates for the size of the annuity market in some countries and impossible for other countries; the figures reported in this table should be treated as approximate.
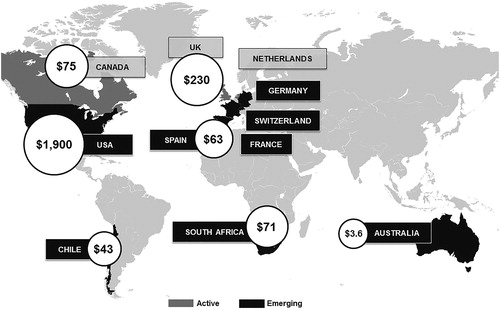
FIGURE 3. Growing Dependencies. Source: OECD (2015), Pensions at a Glance 2015: OECD and G20 indicators, OECD Publishing, Paris. http://dx.doi.org/10.1787/pension_glance-2015-en. Data extracted on 22 Sep 2016.
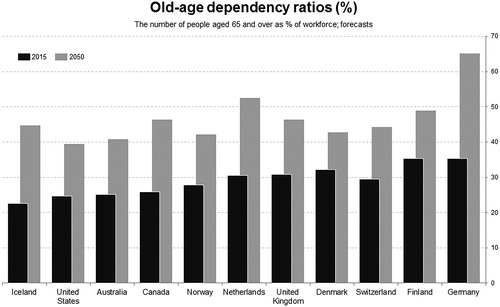
FIGURE 4. Preretirement Income Replacement Rates. 1Source: OECD, 2016. Net pension replacement rates (indicator), doi; 10, 1787/4b03r028-en (accessed on Aug. 26, 2019). The net replacement rate is defined as the individual net pension entitlement divided by net preretirement earnings, taking into account personal income taxes and social security contributions paid by workers and pensioners. Nordics data are average. 2Source: OECD, 2016. Estimates from Global Pension Statistics and OECD calculations using survey data. Coverage rates are provided with respect to the total working-age population (i.e., individuals aged 15–64 years) for all countries except Germany, where coverage rate is provided with respect to employees aged 25 to 64 years old subject to social insurance contributions. Data for Canada do not include participants covered in the Canada Pension Plan. Nordics data are average of mandatory/quasi-mandatory pensions. http://dx.doi.org/10.1787/888933634629 (accessed August 26, 2019).
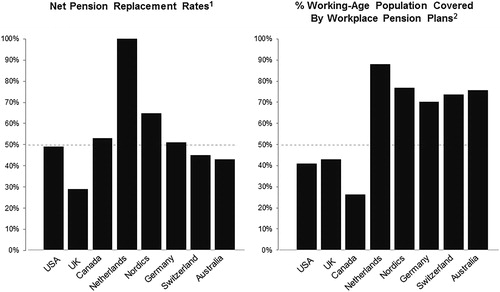
FIGURE 5. Growing Global Marketplace. Note: Data in USD. Sources: LIMRA, Hymans Robertson, LCP and Prudential analysis as of June 30, 2019. *Includes the HSBC $8.7 billion (£7.0 billion) captive longevity swap completed in Q3 2019.
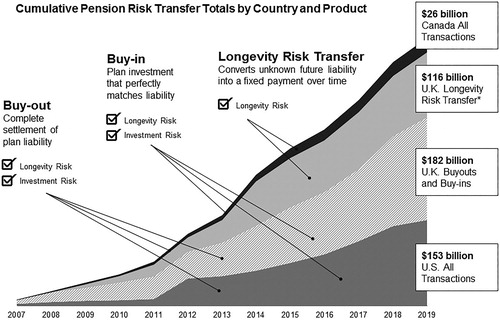
FIGURE 6. Milestones in Pension Derisking. Sources: LCP, Hymans Robertson, LIMRA and Prudential analysis, as of Q3 2019.
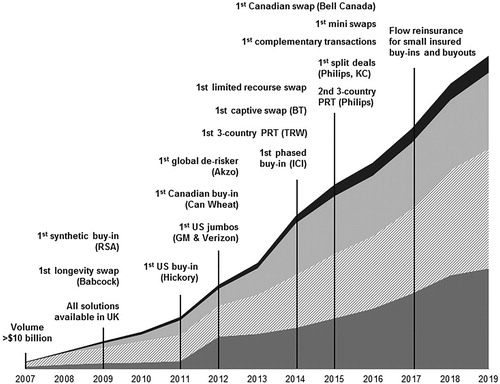
FIGURE 7. Reinsurance Solutions for Jumbo Schemes.
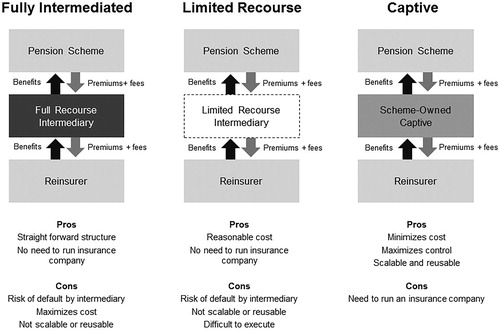
FIGURE 8. U.K. Longevity Transactions Since 2008. Source: Hymans Robertson as of Q3 2019, and Prudential analysis.
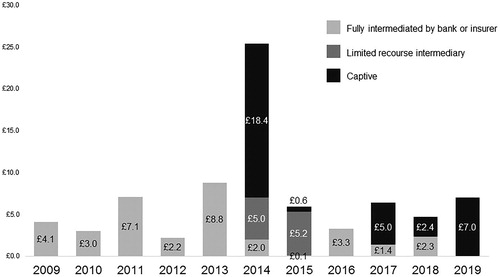
FIGURE 9. Increasing Retired Lifetimes. Source: OECD (2019), Life expectancy at 65 (indicator). https://doi.org/10.1787/0e9a3f00-en (accessed on 13 August 2019).
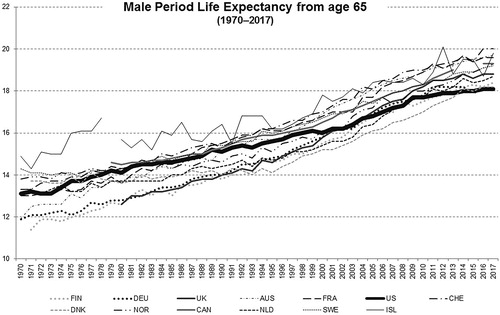
FIGURE 10. Low Rates and Volatile Equities. Source: Barclay’s Live and S&P Capital IQ, as of August 31, 2019.
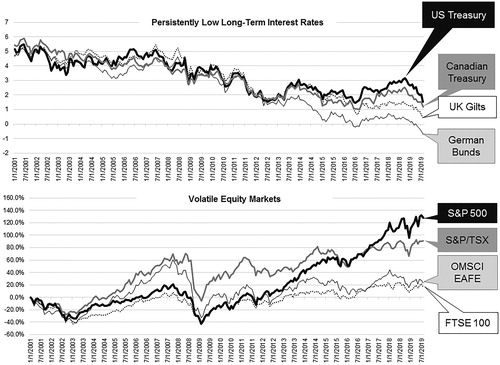
FIGURE 11. Funded Status Volatility. Sources: Milliman 100 Pension Funding Index; the 100 largest U.S. corporate pension plans reporting under GAAP, June 30, 2019 (88.0%). Aon Hewitt, “Aon Hewitt Global Pension Risk Tracker,” as of June 30, 2019 (99.3%). https://PensionRiskTracker.aon.com, accessed August 13, 2019. Funding ratio (cumulative assets/liabilities) of all pension schemes in the FTSE 100 Index on the accounting basis.
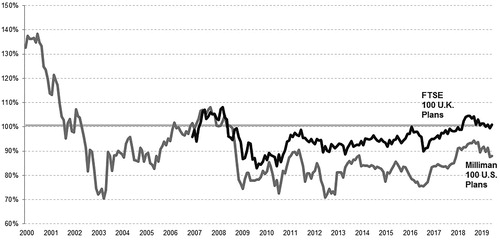
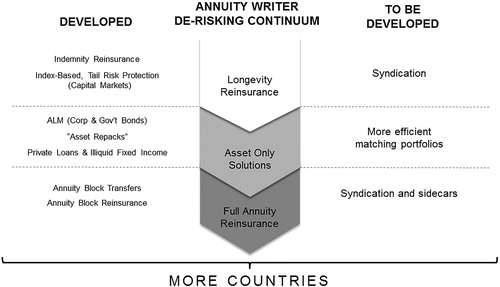
FIGURE 12. Developing New Solutions.
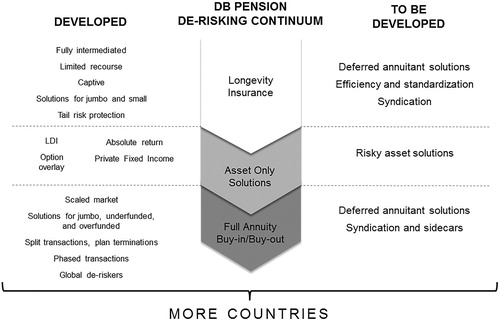
FIGURE 13. Annuity Insurer Transactions. Note: As of July 2019. Source: Prudential analysis of disclosed transactions. Note that many transactions are not disclosed. Transactions have occurred in Germany, Canada, and the United States but transactions sizes were not disclosed. *These deals provide tail risk protection against future longevity improvements.
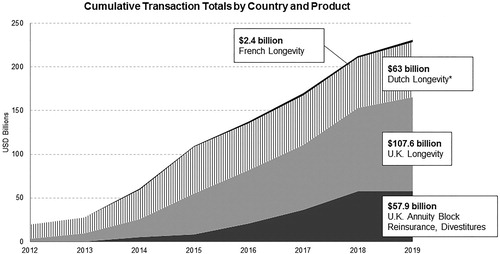
FIGURE 14. Insured Annuity Innovations. Note: As of July 2019. Source: Prudential analysis of disclosed transactions. Note that many transactions are not disclosed. Transactions have occurred in Germany, Canada, and the United States but transactions sizes were not disclosed.
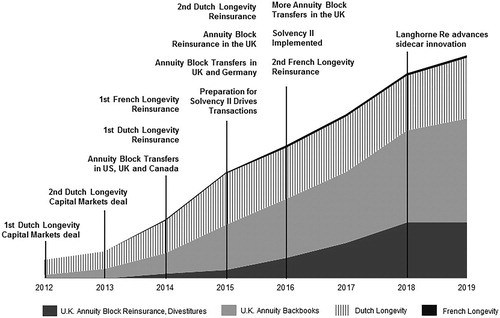
FIGURE 15. Longevity Risk in Alternative Markets. Source: http://www.artemis.bm/library/longevity_swaps_risk_transfers.html. *These Dutch transactions provide “out-of-the-money” tail risk protection against future longevity improvements.
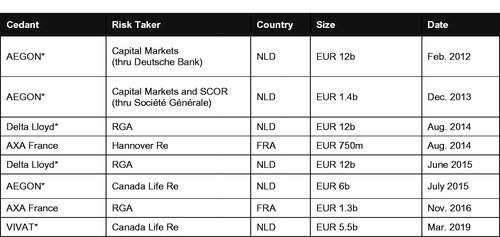
FIGURE 16. Sidecar Solutions.
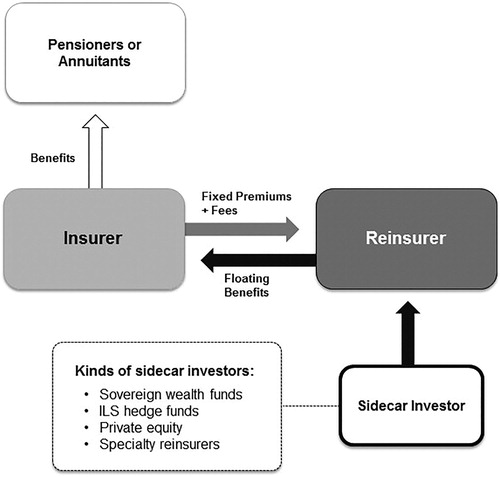
FIGURE 17. Development of Innovative Solutions for Annuity Writers.