
Figures & data
Figure 1. Two-Sided Confidence Limits for VaR for Security Level: (a) p = 0.95 and (b) p = 0.99. Note: Different line styles indicate the method used: BCA-VaR (solid line), par-comp (long dashed line), and non-par (dot-dashed line).
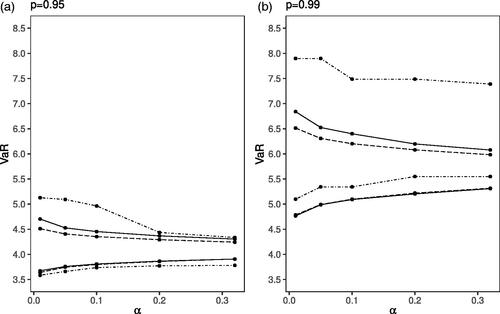
Figure 2. Two-Sided Confidence Limits for CTE for Security Level: (a) p = 0.95 and (b) p = 0.99. Note: Different line styles indicate the method used: BCA-CTE (solid line), par-comp (long dashed line), and non-par (dot-dashed line).
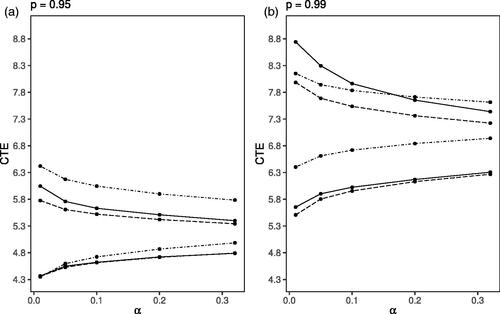
Table 1 Summary of the Interval Estimates for VaR and CTE Based on the Secura Re Dataset
Table 2 Summary of the Computational Parametric and BCA Estimates for VaR and CTE Based on the Secura Re Dataset
Figure 3. Coverage Probability for the Left-Truncated Lognormal Distribution of the Three Estimation Methods: BCA (solid), non-par (dotted), par-comp (dashed). Note: Dashed gray lines denote the expected coverage probability.
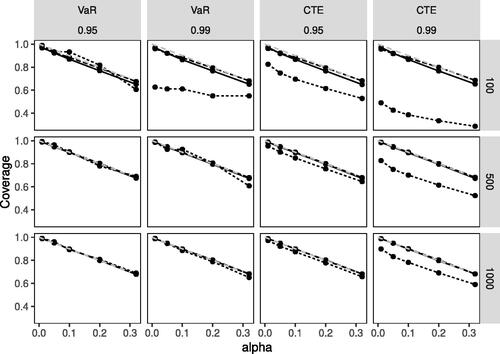
Figure 4. Average Width of the Confidence Interval for the Left-Truncated Lognormal Distribution of the Three Estimation Methods: BCA (solid), non-par (dotted), par-comp (dashed).
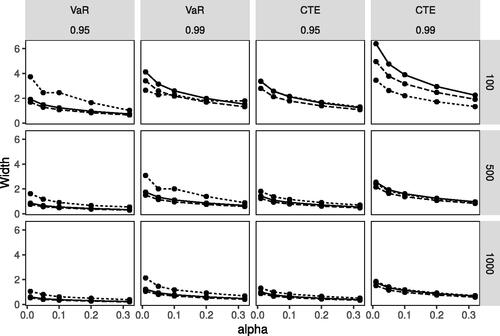
Table 3 Comparison of the Implementation Methods (%): BCA (Top) and Parametric Asymptotic (Bottom).
