Figures & data
TABLE 1 Comparison between Different Regulations
TABLE 2 The Linkage between Fair Pricing Models and Fairness Criteria
Figure 1. Probability Density Plots of Age by Gender Before and after Adjusting for Age Using the DI Remover.
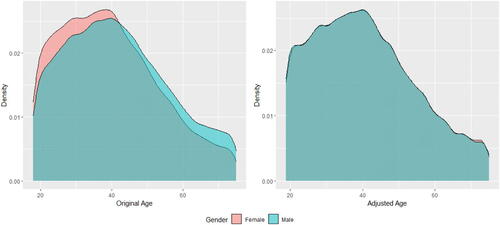
Figure 2. The Effect of DI Remover by Age and Gender.
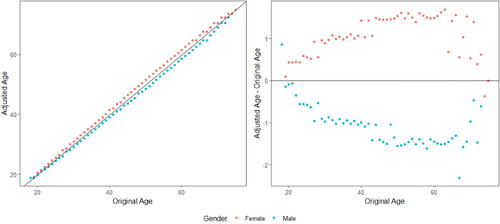
TABLE 3 Comparison of Means of Predicted Pure Premiums by Model, Method, and Gender after Portfolio-Level Adjustment
Figure 3. Fairness–Accuracy Plot (Scenario 1).
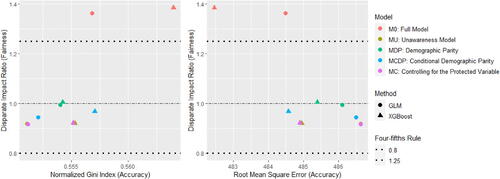
Figure 4. Fairness–Accuracy Plot (Scenario 2).
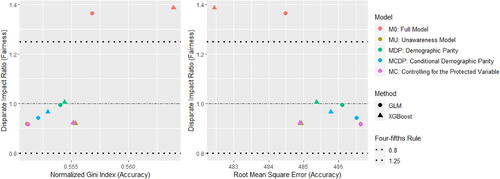
Figure 5. Fairness–Accuracy Plot (Scenario 3).
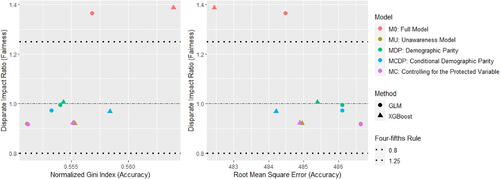
Figure 6. Fairness–Accuracy Plot (Scenario 4).
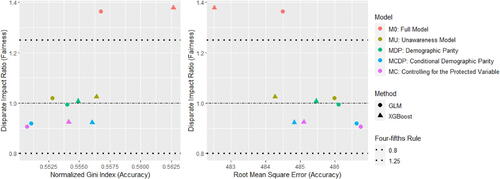
Figure 7. Double Lift Charts by Gender (GLM MDP versus GLM MU).
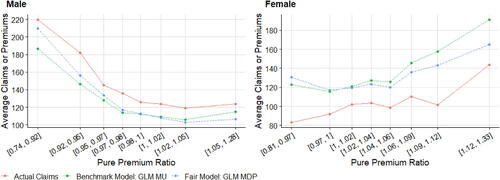
Figure 8. Double Lift Chart (GLM MDP versus GLM MU).
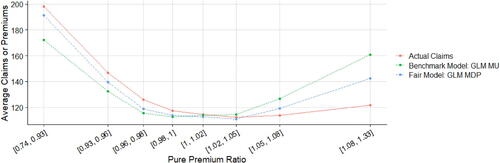
Figure 9. Relative and Average Premium Difference (GLM Models versus GLM MU).
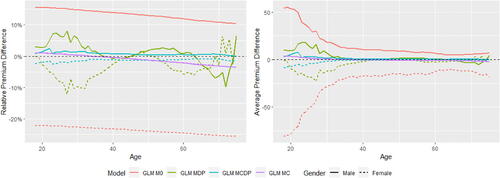
Figure 10. Relative and Average Premium Difference (GLM Models versus GLM M0).
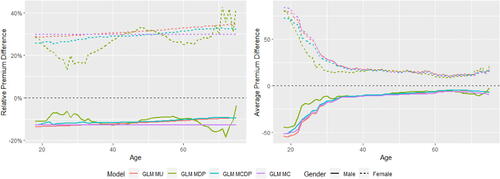
Figure C.1. Double Lift Charts by Gender (GLM MCDP versus GLM MU).
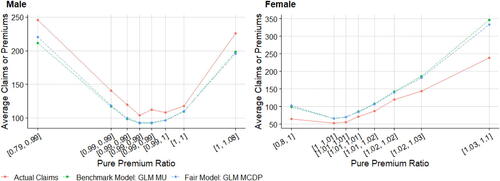
Figure C.2. Double Lift Chart (GLM MCDP versus GLM MU).
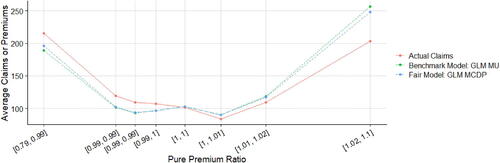
Figure C.3. Double Lift Charts by Gender (XGBoost MDP versus GLM MU).
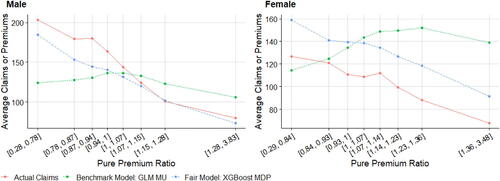
Figure C.4. Double Lift Chart (XGBoost MDP versus GLM MU).
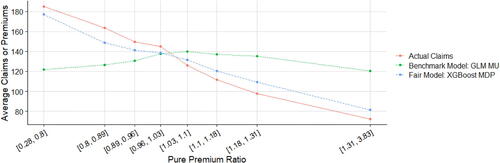
Figure C.5. Double Lift Charts by Gender (XGBoost MCDP versus GLM MU).
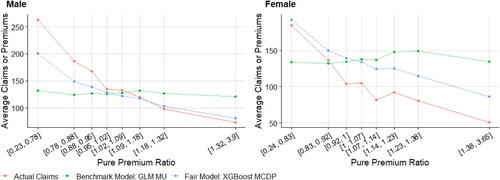
Figure C.6. Double Lift Chart (XGBoost MCDP versus GLM MU).
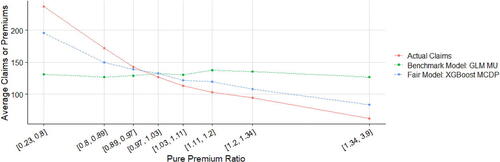
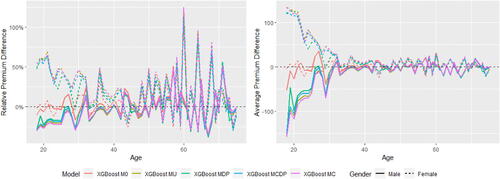
Figure C.7. Relative and Average Premium Difference (XGBoost Models versus GLM MU).
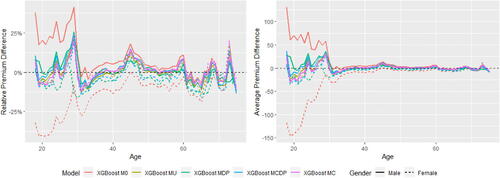
Figure C.8. Relative and Average Premium Difference (XGBoost Models versus GLM M0).
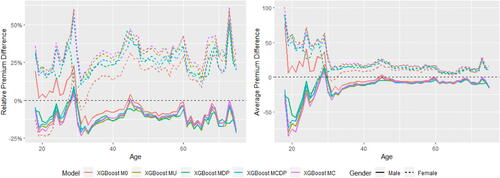
Figure C.9. Relative and Average Premium Difference (GLM Models vs. Actual Claim Costs).
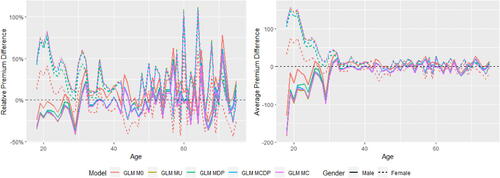
Figure C.10. Relative and Average Premium Difference (XGBoost Models versus Actual Claim Costs).