Figures & data
Figure 1. Localization of EGFR on cell membrane. (a) Distribution of EGFR and caveolin on membrane fractions analysed by western blotting with or without mβCD treatment. Fractions 2 to 10 were membrane fractions from low density to high density. P indicated the resuspended pellet fraction. Figure showed the representative data from two repeated experiments. (b–d) Colocalization analysis of GM1 with EGFR, caveolin or integrin β3 by immunofluorescence assay. (e and f) Colocalization analysis of EGFR with caveolin or integrin β3. Figures showed representative images from three repeated experiments. Scale bar, 10 µm. This figure is reproduced in color in Molecular Membrane Biology online.
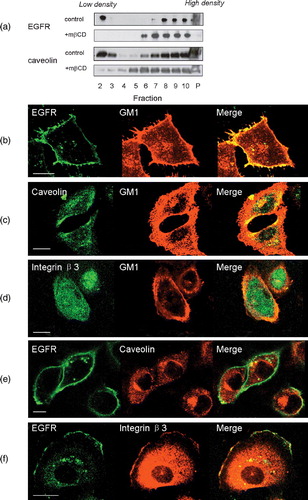
Figure 2. The effect of cholesterol-depletion on EGF-induced chemotaxis in human breast cancer cell lines. (a) Chemotactic dose-responses of normal, cholesterol-depleted and cholesterol-repleted MDA-MB-231 cells toward EGF stimulation (p*** <0.0001, p** =0.0154, two-way ANOVA). Chemotaxis index was calculated as that stated in the Materials and methods section. (b) Chemokinesis of normal and cholesterol-depleted MDA-MB-231 cells induced by EGF. (c) Chemotactic responses of normal and cholesterol-depleted cells toward EGF stimulation in three different human breast cancer cell lines, MDA-MB-231, MCF-7 and T47D cells (p*** ≤0.0001, two-way ANOVA). (d) Chemotactic responses of normal and cholesterol-depleted cells toward SDF-1α stimulation in three different human breast cancer cell lines, MDA-MB-231, MCF-7 and T47D cells (p* <0.05, two-way ANOVA). Data collected in this set of figures were from a representative of at least three repeated experiments. In each experiment, each data point was an average calculated from three chemotactic microchambers.
Figure 3. The effect of cholesterol depletion on EGF-induced cell migration and cell adhesion in MDA-MB-231 cells. (a) In vitro wound-healing assay on normal, cholesterol-depleted and cholesterol-repleted cells with or without EGF stimulation. Cell migration distance upon incubation time was measured after wound was created. EGF, 10 ng ml−1. (b) Cell adhesion of normal, cholesterol-depleted and cholesterol-repleted cells upon EGF stimulation (EGF, 10 ng ml−1, p*** ≤0.0001, two-way ANOVA). (c) Time course of EGF-induced F-actin polymerization on normal, cholesterol-depleted, and cholesterol-repleted cells (EGF, 50 ng ml−1, p=0.0004, one-way ANOVA). The data were collected from one representative of three repeated experiments. Each data point was an average of triplicate assays.
Figure 4. The effect of cholesterol depletion on EGF expression and internalization. (a) MDA-MB-231 cells were treated with (the bottom panel) or without (the top panel) mβCD, stimulated with 50 ng ml−1 EGF for 0, 5, 15, 30, and 60 min, then followed by FACS analysis of surface EGFR. (b) MDA-MB-231 cells were treated with or without m?CD, followed by stimulation with 50 ng ml−1 EGF for 0, 5, 15, 30, 60 min. The levels of EGFR in total cell lysate (the top panel) or in the membrane fraction (the bottom panel) were analysed by western blotting analysis. The amount of caveolin in membrane fraction in each sample was analysed by western blotting and shown at the bottom.
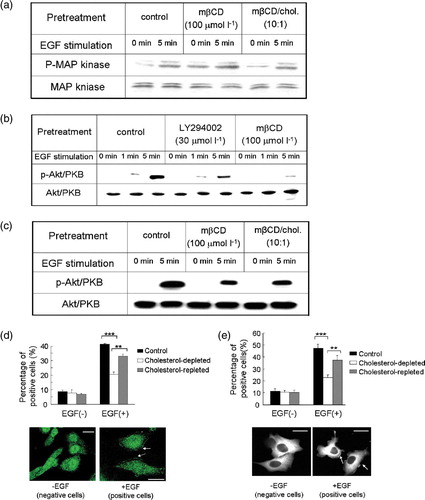
Figure 5. The effect of cholesterol depletion on EGF-induced MAP kinase phosphorylation, Akt activation and PKC?-GFP translocation in MDA-MB-231cells. (a) EGF-induced MAP kinase phosphorylation in the presence or absence of mβCD treatment. Total MAP kinase amount in each sample was analysed by western blotting and shown at the bottom. (b) Akt activation was analysed by western blotting for phosphorylated Akt (p-Akt/PKB) in control, LY294002 treated, and cholesterol-depleted (mβCD) cells upon EGF stimulation. Total Akt/PKB amount in each sample was analysed by western blotting and shown at the bottom. (c) Phosphorylated Akt (p-Akt/PKB) amount in control, cholesterol-depleted, and cholesterol-repleted cells upon EGF stimulation analysed by western blotting. Total input of Akt/PKB in each sample was shown at the bottom of the panel. (d) Akt/PKB cellular translocation of control, cholesterol-depleted, and cholesterol-repleted cells upon EGF stimulation (EGF, 10 ng ml−1). Bar graph, percentage of cells that exhibited Akt/PKB translocation of total examined cells under indicated assay conditions. Data were the mean of triplicate experiments (p*** <0.0001, p**? = 0.0030, two-way ANOVA????Images, representative cells that exhibited Akt/PKB translocation upon EGF stimulation. Arrows showed activated Akt/PKB on the membrane. Scale bar, 20 µm. (ecddd ) PKCζ?GFP translocation of control, cholesterol-depleted, and cholesterol-repleted cells upon EGF stimulation (EGF, 10 ng ml−1). In the bar graph, percentage of cells exhibited PKCζ?GFP translocation of total examined cells under indicated assay conditions. Data were the mean of triplicate experiments (p*** <0.0001, p**=0.0054, two-way ANOVA???In?images, representative cells displayed PKCζ-GFP cellular translocation upon EGF stimulation. Arrows showed activated PKCζ-GFP on the membrane. Scale bar, 30 µm. This figure is reproduced in color in Molecular Membrane Biology online.