Figures & data
Fig. 1. Map showing general sampling locations across Pennsylvania with county names and status, with their delineated upstream watersheds shown in inset maps A, B, and C. Numbers correspond to watershed characteristics found in Table 1.
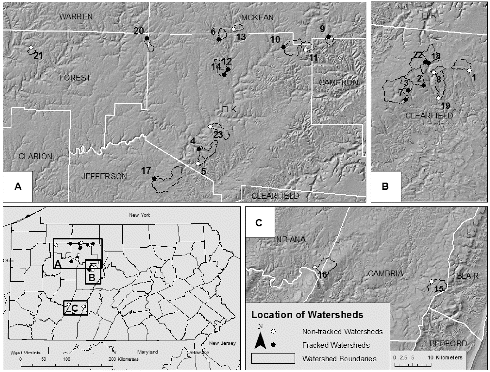
Table 1. Watershed (WS) characteristics of streams sampled where N stands for sites with no fracking within their watershed (n = 10) and F stands for sites where fracking has occurred within their watershed (n = 14) (df = 21). Conventional wells are oil wells pre-dating Marcellus shale natural gas exploration.
Table 2. Comparison of water quality and chemistry, mercury concentrations, and biodiversity measures between fracked and non-fracked study sites. TDS represents total dissolved solids, DOC represents dissolved organic carbon, PTHg represents particulate total mercury, PMeHg represents particulate methylmercury, FTHg represents dissolved total mercury and FMeHg represents dissolved methylmercury.
Fig. 2. Significant negative correlation between number of well pads within a watershed and stream water pH (Pearsons r = -0.74, P = 0.0001). Blackened circles represent fracked sites and open circles represent non-fracked sites.
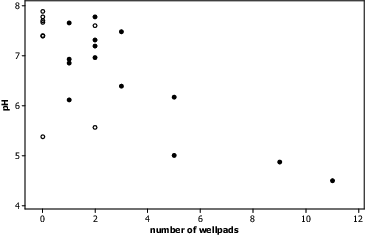
Fig. 3. Above scatterplot A shows decreasing fish diversity (Simpson's Diversity Index) with increasing number of well pads for fracked sites (n = 14, r = -0.60, P = 0.02). Scatterplot B shows significant positive correlation between pH and fish species diversity (r = 0.70, P = 0.0001) with blackened circles representing fracked sites and open circles representing non-fracked sites. Similar strength correlation observed for scatterplot A when non-fracked sites included.

Table 3. Pearsons correlations of bacterial taxonomic relative abundances to the number of Well pads and FTHg (dissolved total mercury)
Fig. 4. Above boxplot represents stream mean (trout, crayfish, macroinvertebrates) or composite (sediment and moss) THg values for each compartment. Grey boxplots indicate fracked sites (n = 14), while white boxplots indicate non-fracked sites (n = 10). P values on figure indicate significant differences (P < 0.05) among compartments were observed with trout>moss>crayfish>macroinvertebrates/sediment. No significant differences were observed across all sites between mean macroinvertebrate Hg concentration (across feeding groups) and Hg concentration in stream bed sediments (P > 0.10). One fish Hg concentration value does not appear on the above boxplot (249.10 ng/g). Boxplots show first quartile (25%), median line, and third (75%) quartiles represented by boxes. Upper and lower whiskers extend to data within 1.5 box height, and outliers are represented by asterisks.
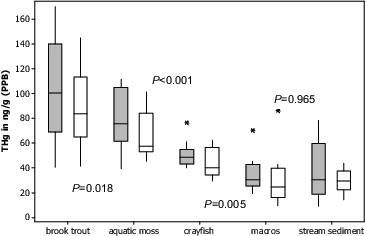
Fig. 5. Individual value plot showing Hg concentration in fish filets for all fish (n = 73) across all sites (n = 24) with Map ID numbers. Blackened circles represent fish from fracked sites and opened circles represent non-fracked sites. The dotted line represents the USFWS fish eating bird and wildlife Hg regulatory criteria (100 PPB) and the solid line represents the USEPA's regulatory criteria for Hg for human consumption of fish (300 PPB).
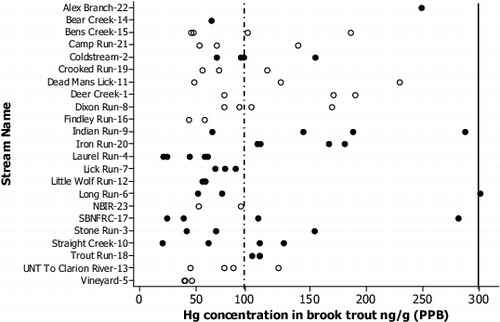
Table 4. Correlation analysis matrix showing relationships aHg concentration in brook trout muscle tissue and organs when divided into fracked (F) and non-fracked (N) streams. Data was normalized using log10 transformation.
Fig. 6. Scatterplot A shows a significant positive correlation between number of well pads within a watershed and mean crayfish Hg concentration for given stream (r = 0.79, P < 0.001, n = 24). Scatterplot B shows a positive correlation between number of well pads and THg concentration in predatory macroinvertebrates (r = 0.71, P = 0.001, n = 22). Blackened circles represent fracked sites and open circles represent non-fracked sites. Relationships strengthened when stream sites with no Marcellus well pads were removed (A-r = 0.83, B-r = 0.76).
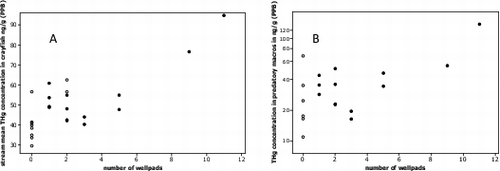
Fig. 7. Scatterplot A shows a significant negative correlation between stream pH and mean crayfish Hg concentration for given stream (r = 0.63, P = 0.001, n = 24). Scatterplot B shows a weak negative correlation between stream pH and THg concentration in predatory macroinvertebrates (r = 0.50, P = 0.03, n = 22). Blackened circles represent fracked sites and open circles represent non-fracked sites.
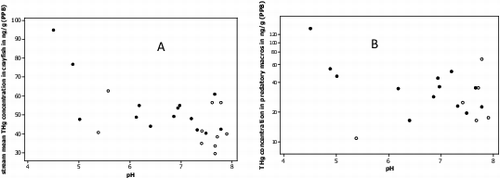
Table 5. Crayfish data including species, sizes, and Hg concentration by stream and status of watershed. N stands for sites with no fracking within their watershed and F stands for sites where fracking has occurred within their watershed.
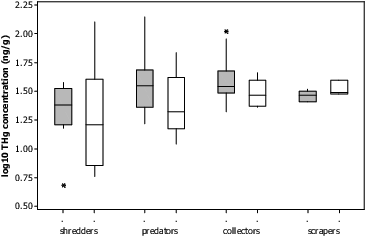
Fig. 8. Above boxplot represents distribution of Log10 of THg concentration in feeding groups of macroinvertebrates. Grey boxplots indicate samples from fracked sites, while white boxplots indicate non-fracked sites. Predator and collector concentrations were found to be significantly higher than shredders (P < 0.05), with predators also showing significant differences between fracked and non-fracked sites (P < 0.05). Hg concentration in shredders and scrapers were not found to be significantly different between fracked and non-fracked streams (P > 0.10). Boxplots show first quartile (25%), median line, and third (75%) quartiles represented by boxes. Upper and lower whiskers extend to data within 1.5 box height, and outliers are represented by asterisks.