
Figures & data
Figure 1. Chemical structures of neomycin B and C, neamine (neomycin A), neobiosamine (divided by dotted line) and di-substituated 2-deoxy streptamine (2-DOS). NA means not applicable.
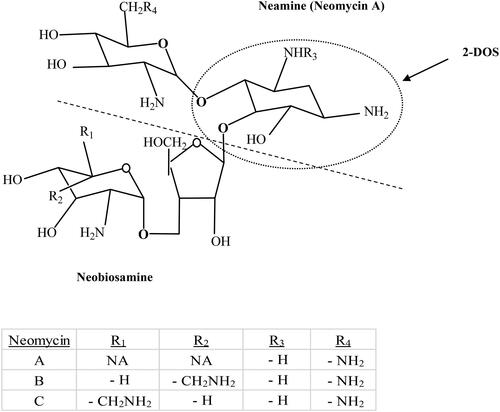
Figure 2. Full scan spectrum of neomycin calibration standard at a concentration of 10 mgL−1.
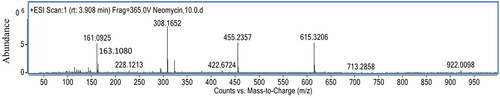
Figure 3. Chemical structures of abundant neosamine B (a) and ribostamycin (b) ions.
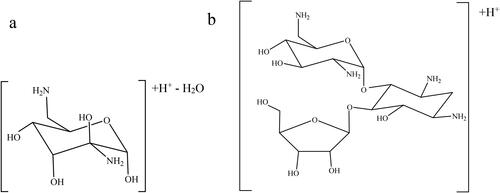
Figure 4. Time course decline of neomycin. Neomycin added at 10 mg L−1. Symbols: EC1 (■), HKC (◊), ECM1 (^), EC2 (▲), ECM2 (Х), CC (+).
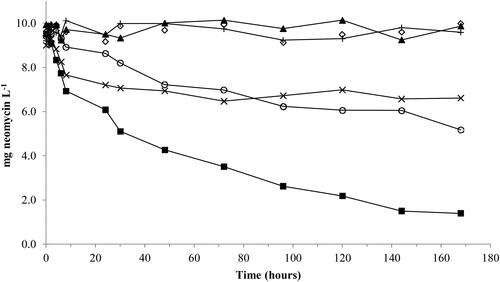
Table 1. Summary of kinetic parameters of degradation of neomycin using different experimental conditions.
Figure 5. Laccase enzymatic activities during the 168 h time course. Symbols: EC1 (■), ECM1 (^), EC2 (▲) and ECM2 (Х).
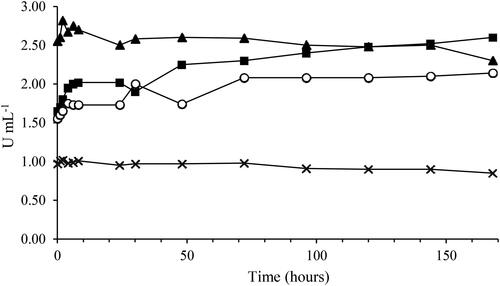
Figure 6. Time course decline of neomycin using EC1 experimental conditions 0–240 h (a) and initial part, 0–8 h (b). The experiment was performed in triplicate. Symbols: ■ shows mean results at each sampling occasion including standard deviation (SD) error bars. The symbols □, ^ and Δ show initial individual results.
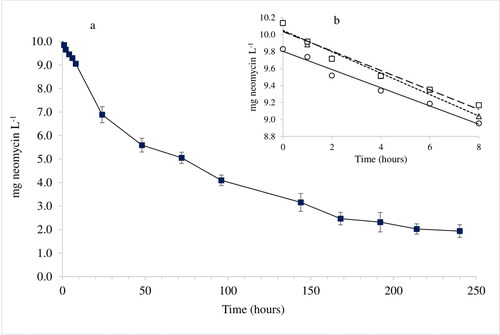
Figure 7. Proposed biodegradation pattern of neomycin, where B-E show possible structural isomers of oxidation products of neosamine C (A). The tentative identities of the oxidation products (excluding isomer elucidation) could be verified by UHPLC-Q-TOF MS analyses. The *-sign indicates possible additional open-chain structures. Extracted ion chromatograms (EC1, 144 h) at m/z 157.0613 (C and D) and at m/z 175.0716 (E).
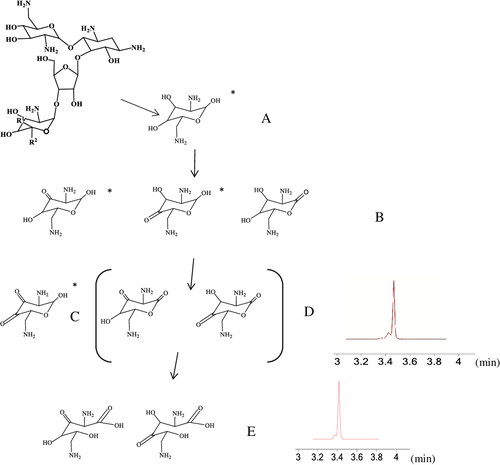
Figure 8. Proposed biodegradation pattern of neomycin, where G and H show possible structural isomers of oxidation products of 2-DOS (F). The tentative identities of the oxidation products (excluding isomer elucidation) could be verified by UHPLC-Q-TOF MS analyses.
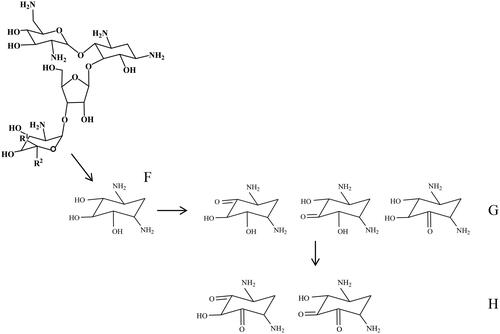
Table 2. Summary of the accurate mass measurements of hydrolysis and oxidation products of neomycin, as determined for their abundant adduct ions using UHPLC-Q-TOF MS.
Figure 9. Time course of oxidation product D at m/z 157.0613 (a) and oxidation product E at m/z 175.0716 (b). Symbols: EC1 (■) and ECM2 (Х).
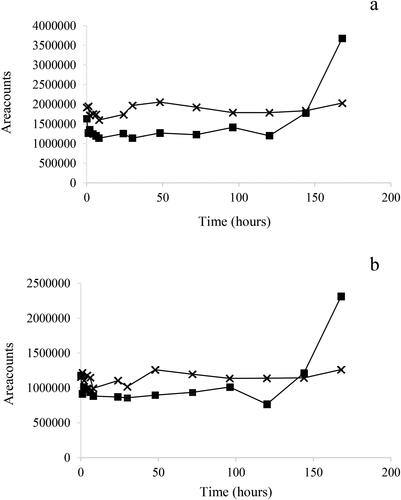
Figure Caption ok
Availability of data and materials
The data that support the findings of this study are available from the corresponding author at reasonable request.