
Figures & data
Figure 1. Locations of zone II and the five pharmaceutical factories (A, B, C, D, and E).
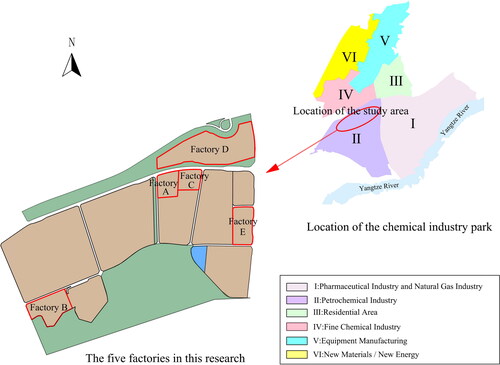
Figure 2. Average emissions and leak rate of a) individual components in each factory b) different types of components.
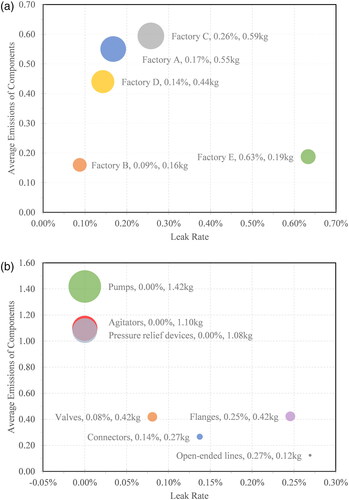
Figure 3. Average emissions per component in the factories.
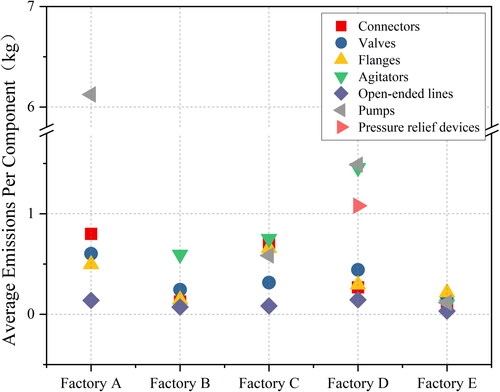
Table 1. Average and reduction emissions (kg/pc) for each component before and after leak detection and repair (LDAR).
Figure 4. Percentage contribution to the total fugitive emission of volatile organic compounds (VOCs) from the equipment and facilities emissions. (LDAR, leak detection and repair).
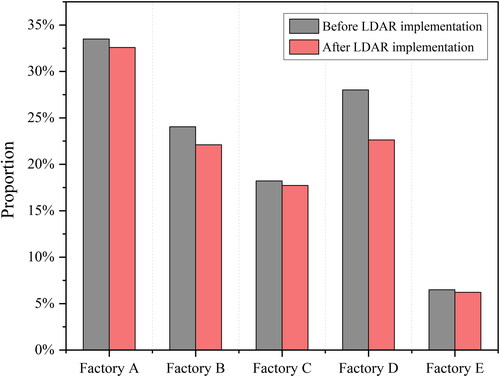
Table 2. Simulated emissions before and after repair in the five factories and the limited value for fugitive emissions of volatile organic compounds (VOCs) from China’s national standards.
Figure 5. Hourly concentration distribution of volatile organic compounds (VOCs) before leak detection and repair (LDAR) implementation.
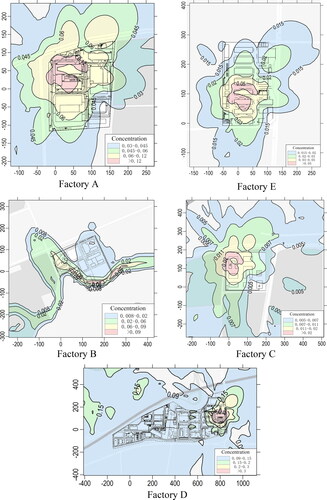
Figure 6. Hourly concentration distribution of volatile organic compounds (VOCs) after leak detection and repair (LDAR) implementation.
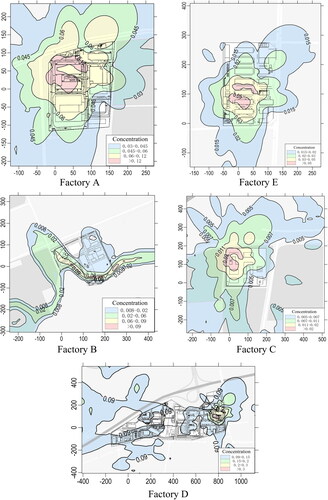
Figure 7. Predicted grid concentration of volatile organic compounds (VOCs) in the five factories.
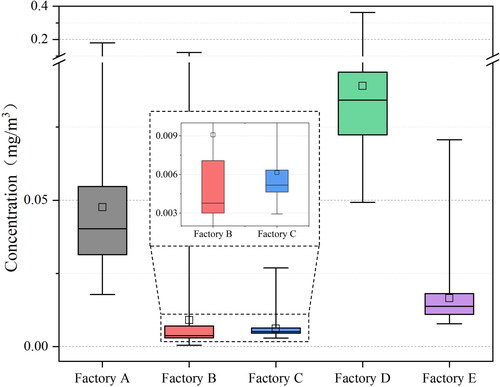
Figure 8. Maximum predicted concentration and measured concentration at the factory boundary.
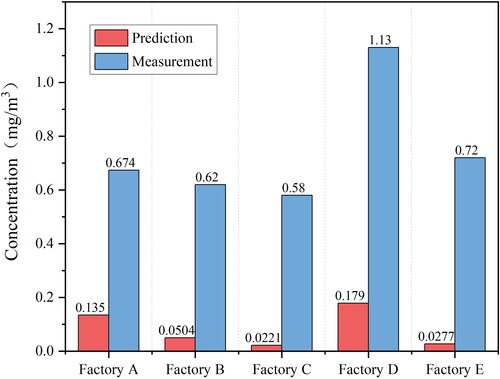
Figure 9. Chronic health risks of volatile organic compounds (VOCs) through inhalation for on-site workers in the five factories (HQ, hazard quotient).
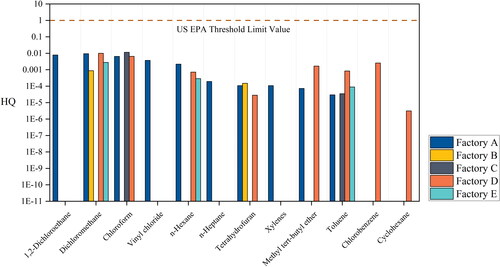
Figure 10. Lifetime cancer risks of volatile organic compounds (VOCs) through inhalation for on-site workers in the five factories (LCR, lifetime cancer risk).
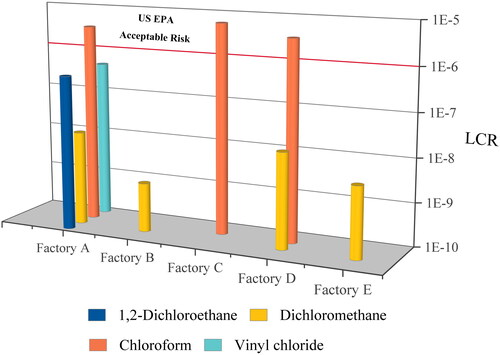
Table A1. Longitude and latitude of the five factories.
Table A2. Number of monitored components and leaks
Table A3. Emissions (kg) before and after leak detection and repair (LDAR) implementation
Table A4. Non-cancer reference concentrations and inhalation unit reference for carcinogenic volatile organic compounds (VOCs)
Table A5. Hazard quotient values for fugitive emissions of volatile organic compounds (VOCs) from equipment and facilities in five factories
Table A6. Lifetime cancer risk values for fugitive emissions of volatile organic compounds (VOCs) from equipment and facilities in the five factories.
Table A7. Main products, solvents, scale and disposal techniques in the five factories.
Data availability statements
The data that support the findings of this study are available from Key Laboratory for Urban Atmospheric Environment Integrated Observation & Pollution Prevention and Control of Chongqing but restrictions apply to the availability of these data, which were used under license for the current study, and so are not publicly available. Data are however available from the authors upon reasonable request and with permission of Key Laboratory for Urban Atmospheric Environment Integrated Observation & Pollution Prevention and Control of Chongqing.