
Figures & data
Figure 1. A schematic diagram of the liver (posterior view) showing the direction of blood flow indicated via arrows. Accompanied by a magnified representation of an individual lobule.
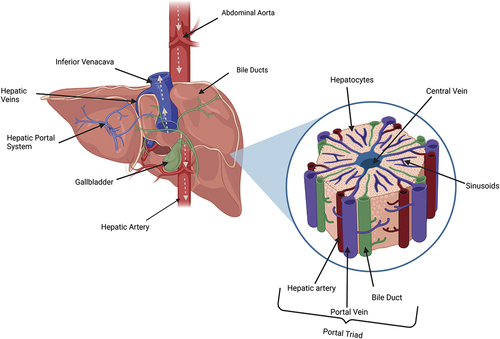
Figure 2. Generalized hepatic pathological alterations associated with mitochondrial dysfunction resulting from an adverse drug reaction. Oxidative stress induces calcium over-load which initiates further subsequent accumulation of ROS. The oxygen species damages mitochondrial DNA, alter protein functions, limit mitochondrial respiration leading to lower levels of ATP and activate mitochondrial permeability transition pores. This increases permeability and eventual mitochondrial membrane rupture.
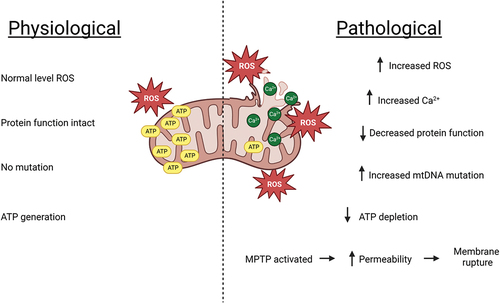
Table 1. Summary of mechanisms of hepatic immune tolerance in the healthy liver (Bottcher, Knolle, and Stabenow Citation2011; Doherty Citation2016; Heymann et al. Citation2015; Teigs and Lohse Citation2009).
Figure 3. Simplified diagrammatic representation of the causation and implications of MHC class I and II cells in immune-mediated DILI. The necrosis of hepatocytes might be directly induced by accumulation of toxic drug metabolites. Damage associated molecular patterns (DAMPs) recruit natural killer and Kupffer cells. Hapten-like drug-protein adducts bind with MHC II cells and this leads to upregulation of transcription factors such as FAS and TNF-α that initiate a further immune cascade increasing the severity of hepatocyte damage.
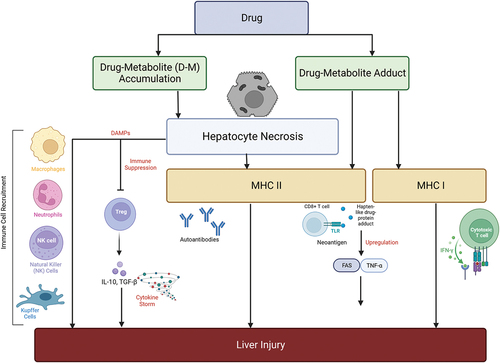
Figure 4. Molecular events involved in DILI during hepatocellular and cholestatic injuries. Hepatocyte injury is initiated by an increase in oxidative stress resulting from ROS imbalance, endoplasmic reticulum stress, ATP depletion, mitochondrial dysfunction, calcium overload, glutathione depletion, protein dysfunction and BSEP inhibition. BSEP inhibition may lead to bile duct injuries such as obstruction, accumulation of bile salts and interference in sinusoidal uptake. DAMPs are released upon hepatocyte damage and initiate further inflammation. Reactive metabolites might also activate the immune response via drug-protein adducts, haptens, TLR binding, mistargeting of peptides, MHC II binding release of pro-inflammatory cytokines in a positive loop with upregulation of the recruitment of additional immune cells.
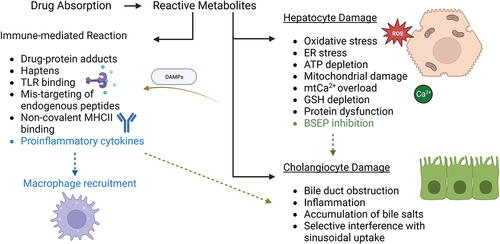
Table 2. Summary of global DILI incidence showing origin, most common offending drug and the population investigated.
Figure 5. Causative drug classifications and their prevalence in “Eastern” locations compared to “Western” locations using meta-analysis data collected by (Low et al. Citation2020) using 28 studies focused on incidences of DILI initiated by anti-TB, anti-retroviral therapy, herbal drugs and supplements, NSAIDs, psychotropic and antibiotic drugs. In this instance, “East” includes data from Asia and Africa – frequently considered the Eastern world, while “West” includes data from Europe, United States of America, New Zealand and Australia – commonly referred to as the Western world.
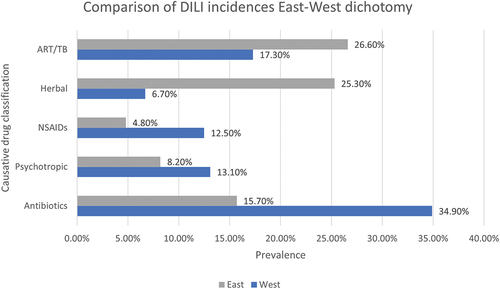
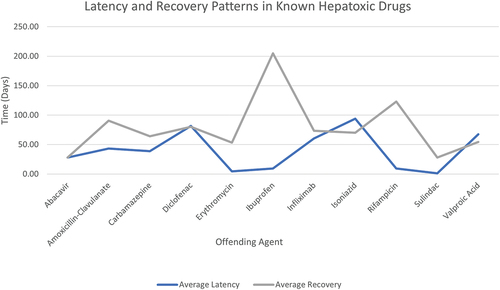
Figure 6. Average latency from drug start to onset of symptoms and mean recovery period to normal liver enzyme levels in patient case studies reported in LiverTox (Citation2012a, Citation2012b, Citation2012c, Citation2012d, Citation2012e, Citation2012f, Citation2012g, Citation2012h, Citation2012i). Incomplete data such as scenarios involving patient fatalities have been excluded.
Data availability statement
Data sharing is not applicable to this article as no new data were created or analyzed in this study.