
Figures & data
Figure 1. PRISMA flow chart depicting the literature search and the evaluation process for finding relevant records.
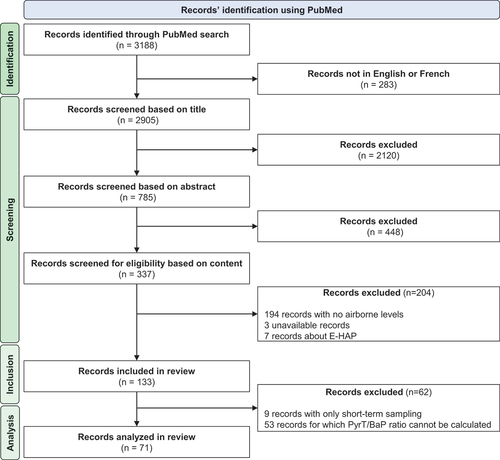
Figure 2. PyrT/BaP ratios at the sector scale depending on the sampling period Green points refer to data from E-HAP while yellow points refer to data from the literature.
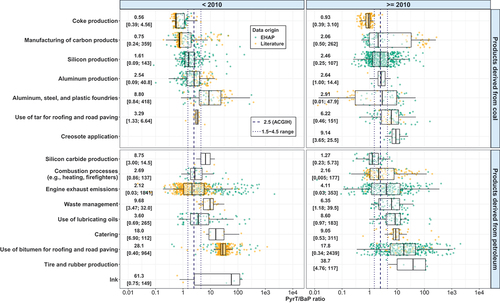
Figure 3. Comparison of the variability of PyrT/BaP ratios between sectors GSD: geometric standard deviation, n: number of processes within a sector, m: number of activities within a sector.
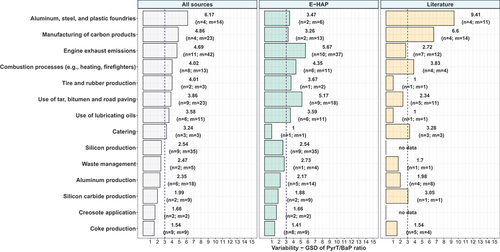
Figure 4. Comparison of the PyrT/BaP ratio variability within sectors at the process level GSD: geometric standard deviation, n: number of processes within a sector, m: number of activities within a sector.
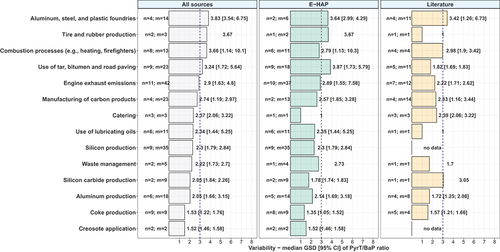
Figure 5. Comparison of the PyrT/BaP ratio variability within sectors at the activity level GSD: geometric standard deviation, m: number of activities within a sector.
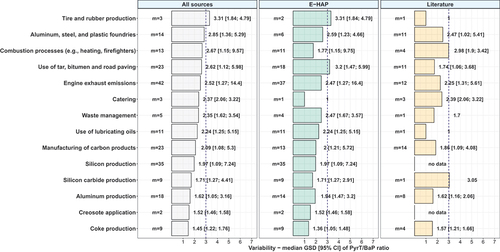
Table 1. PyrT/BaP ratios for each sector.
Figure 6. BGV recommendation for sectors using products derived from coal.
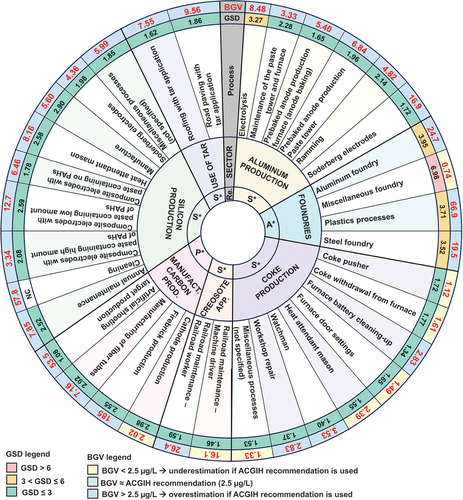
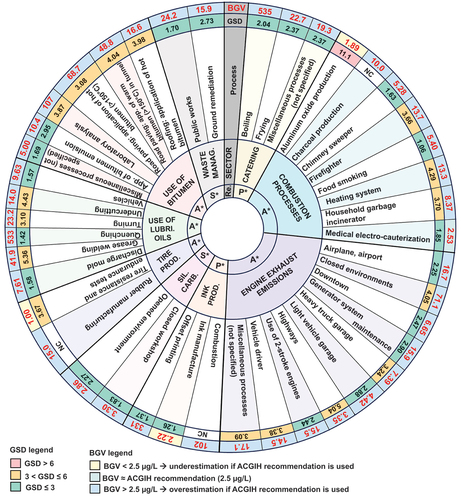
Figure 7. BGV recommendation for sectors using products derived from petroleum.
Supplemental Material
Download Zip (10.6 MB)Data availability statement
The data that supports the findings of this study is openly available on the PAH HBM tool at https://exporisk-timc.imag.fr/PAH/. Further information is available from the corresponding author upon request.