
Figures & data
Figure 1. Hypothesised relationship between social media usage and overtourism.
A figure of the interrelationships among the dependent (overtourism) and independent variables (information seeking, entertainment, self-presentation, socialisation, social media usage, and tourist flows concentration).
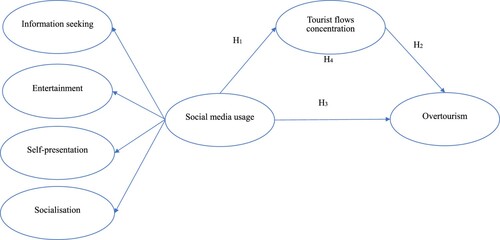
Figure 2 #Study area (Xinhua, Citation2019).
A map of the specific study area (Hangzhou, the capital of Zhejiang Province) where we collected our survey data.
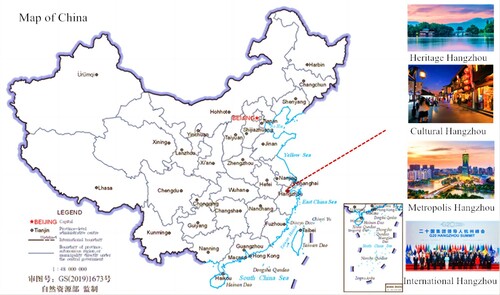
Table 1. Growth of Hangzhou population and tourists (2017–2019).
Table 2. Benchmarks for cities to assess overcrowding risk.
Figure 3. Factor loadings and path coefficients (PLS algorithm estimates).
A diagram portraying constructs of the study along with their respective factor loadings and path coefficients.
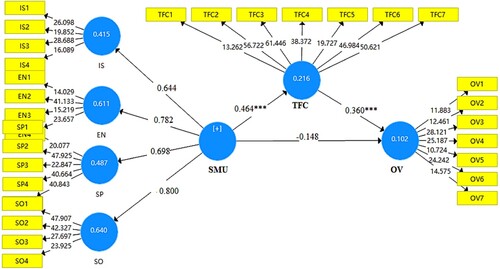
Table 3. Respondents profiles.
Table 4. Features of Hangzhou tourism.
Table 5. Tourists’ social media utilisation with overtourism.
Table 6. Measurement model assessment results.
Table 7. Discriminant validity (HTMT).
Table 8. Hypothesis-testing results.