Figures & data
Figure 1. Mobile monitoring system for silt loading measurement.
Table 1. Analysis of PM10 fraction in the silts sampled from various sites according to land use
Figure 2. PM10 fraction (volume %) of silt (<75 μm) sampled on active traffic lanes versus silt loading.
Table 2. Criteria for eligible data for the data obtained per second
Table 3. Basic statistical information on Seoul and Incheon (as of 2007)
Figure 3. Silt loading maps of paved roads in (a) Seoul and (b) Incheon.
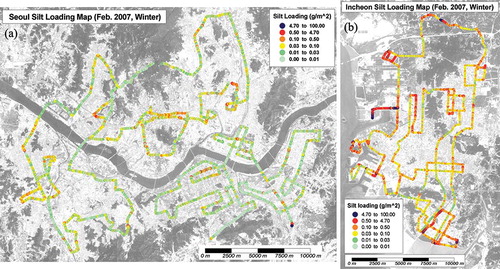
Figure 4. Local average silt loadings of each road segment in (a) Seoul and (b) Incheon.
Table 4. Effects of the hot-spot data treatment on calculating the average silt loading
Figure 5. Comparison of the actual hot-spot data with the corrected data used for the calculation average silt loading.
Figure 6. Change in silt loading during the 1-yr period in Seoul and Incheon.
Figure 7. Silt loading characteristics according to land use and the seasons in Incheon during the year 2006.
Figure 8. Daily variation of average silt loading on the test roads of Incheon during 1 week.
Figure 9. Variation of average silt loading measured every 3 hr on the test roads of Incheon during 24 hr.
Figure 10.Variation of silt loading according to the number of traffic lanes.
Figure 11. (a) Correlation between the average travel speed of the mobile monitoring system and the posted speed limit. (b) Correlation between the average ΔDust value and the average travel speed of the mobile monitoring system.

Figure 12. Change of average silt loading after rainfall event 1.
Figure 13. Change of average silt loading after rainfall event 2.
Figure 14. Change in silt loading after rainfall event 2: (a) silt loading map before rainfall and (b) silt loading map after rainfall (A: industrial complex I, B: industrial complex II, C-1 and C-2: port areas, D: industrial complex III, E: industrial complex IV).