Figures & data
Table 1. Uranium and thorium decay series leading to production of radon and thoron
Figure 1. Illustration of radon transport processes in a landfill and landfill construction used in numerical simulations (thicknesses not to scale).
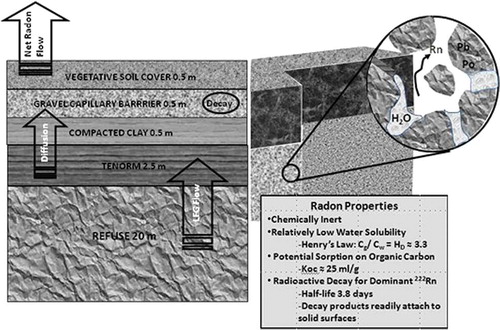
Table 2. Hydraulic properties assigned to material types used in landfill model
Table 3. Transport properties assigned to material types used in landfill model
Figure 2. Configuration of LFG collection wells. (A) Passive vent wells. (B) Active collection system with central vent well.
Table 4. Summary of Radon emission rates from the landfill model simulations
Figure 3. Summary of radon emission rates for the various landfill cover and LFG collection scenarios.
Figure 4. Radon mass decayed versus radon emissions from the LFG system.
Figure 5. Simulated atmospheric radon activity at 2-m elevation. (A) Landfill with no LFG production, emissions by diffusion only. (B) Landfill with clay cover and passive LFG vent system. (C) Landfill with geomembrane cover and passive LFG vent system. Note that atmospheric activities are computed analytically only at locations in the computational grid. The plumes would extend outside the computational grid (color figure available online).
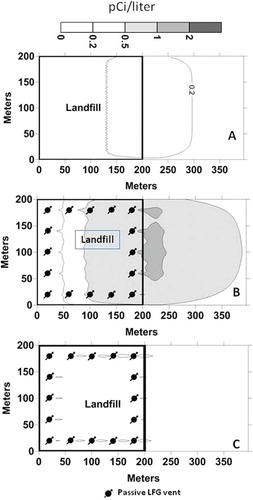
Figure 6. Simulated atmospheric radon activities at 2-m elevation. (A) Landfill with clay cover, LFG generation, and no LFG control system. (B) Landfill with clay cover and active LFG control system. (C) Landfill with geomembrane cover and active LFG control system. Note that atmospheric activities are computed analytically only at locations in the computational. The plumes would extend outside the computational grid.
Figure 7. Equivalent 222Ra surface flux computed for the various landfill scenarios. Equivalent surface flux is the total emission rate from the landfill surface and LFG control wells divided by the landfill cell area.