Figures & data
Figure 1. Effect of calcination temperature on surface area, pore volume, and pore diameter of the Mn/TiO2 catalysts.
Figure 2. X-ray diffraction patterns of the Mn/TiO2 catalysts with different calcination temperatures (A = anatase TiO2; R = rutile TiO2).
Figure 3. H2-TPR profiles of the Mn/TiO2 catalysts with different calcination temperatures.
Figure 4. NH3-TPD profiles of the Mn/TiO2 catalysts with different calcination temperatures using TCD.
Figure 5. NH3-TPD profiles of the Mn/TiO2 catalysts with different calcination temperatures using mass spectrum. (A) Investigation of NH3, O2 and H2O; (B) investigation of N2, NO, N2O, and NO2 (color figure available online).
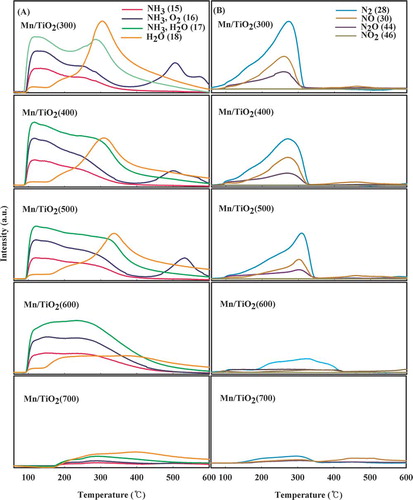
Figure 6. NO-TPD spectra of the Mn/TiO2 catalysts with different calcination temperatures using mass spectrum. (A) Investigation of NO; (B) investigation of NO2.
Figure 7. Oxidation activity of NO to NO2 by O2 on the Mn/TiO2 catalysts with different calcination temperatures. (Reaction condition: 200 ppm NO, 8% O2, 6% H2O, GHSV = 60,000 hr−1).
Figure 8. NOx conversion of the Mn/TiO2 catalysts with different calcination temperatures. (Reaction condition: 200 ppm NOx, 8% O2, 6% H2O, NH3/NOx = 1, GHSV = 60,000 hr−1).