1,329
Views
58
CrossRef citations to date
0
Altmetric
Technical Papers

Multispecies remote sensing measurements of vehicle emissions on Sherman Way in Van Nuys, California

, , &
Pages 1127-1133 | Published online: 24 Sep 2012

Figures & data

Table 1. Summary of emissions, measurement specifics, and observed driving mode

Figure 1. The measured Sherman Way fleet fraction versus model year for 1990 and newer models. The 1989 and older vehicles make up 3.5% of the total fleet. The 2001 recession is not detectable in this data set, whereas the 2008 downturn is quite striking in its magnitude and has rapidly aged the vehicle fleet.
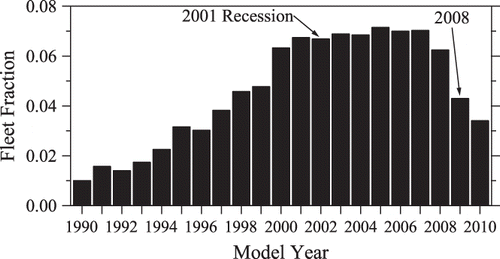
Figure 1. The measured Sherman Way fleet fraction versus model year for 1990 and newer models. The 1989 and older vehicles make up 3.5% of the total fleet. The 2001 recession is not detectable in this data set, whereas the 2008 downturn is quite striking in its magnitude and has rapidly aged the vehicle fleet.

Figure 2. Amount of overlap among remote sensing measurements responsible for highest 50% of observed CO, HC, and NO. Values shown are the percentage of measurements found within each segment of the 12,929 total measurements constituting the figure. Total area outside of circles, but contained within the drawn rectangle, is 92% of all measurements. All areas within the rectangle shown in this figure are drawn to scale.
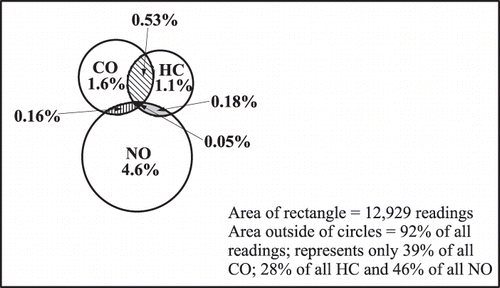
Figure 2. Amount of overlap among remote sensing measurements responsible for highest 50% of observed CO, HC, and NO. Values shown are the percentage of measurements found within each segment of the 12,929 total measurements constituting the figure. Total area outside of circles, but contained within the drawn rectangle, is 92% of all measurements. All areas within the rectangle shown in this figure are drawn to scale.

Table 2. On-road remote sensing emissions compared with reported historical values collected at the Van Nuys Airport tunnel

Figure 3. Mean g NH3/kg emission versus vehicle age for the Sherman Way data (filled triangles) compared with three California sites measured in March of 2008. Vehicle age has been defined as the difference between the fractional measurement year and the vehicle model year. The error bars plotted are standard errors of the mean calculated using the daily model year means and all of the emission values have been calculated assuming a fuel carbon fraction of 0.85.
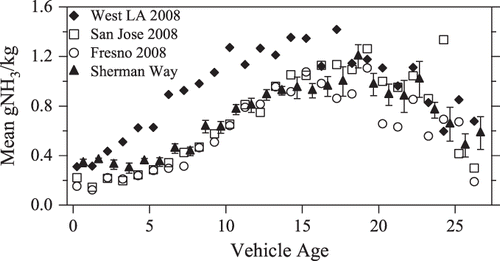
Figure 3. Mean g NH3/kg emission versus vehicle age for the Sherman Way data (filled triangles) compared with three California sites measured in March of 2008. Vehicle age has been defined as the difference between the fractional measurement year and the vehicle model year. The error bars plotted are standard errors of the mean calculated using the daily model year means and all of the emission values have been calculated assuming a fuel carbon fraction of 0.85.

Table 3. Emission comparison for the weekday and weekend data

Reprints and Corporate Permissions

Please note: Selecting permissions does not provide access to the full text of the article, please see our help page How do I view content?

To request a reprint or corporate permissions for this article, please click on the relevant link below:

Academic Permissions

Please note: Selecting permissions does not provide access to the full text of the article, please see our help page How do I view content?

Obtain permissions instantly via Rightslink by clicking on the button below:

If you are unable to obtain permissions via Rightslink, please complete and submit this Permissions form. For more information, please visit our Permissions help page.