Figures & data
Figure 1. Layout of the two-barn finishing farm. Emission monitoring was conducted in rooms 5 to 8 in barn 2.
Figure 2. Floor plan of barn 2 (rooms 5 to 8) showing general locations for sampling and measurement. Arrows in front of the heaters indicate hot air exhaust directions.
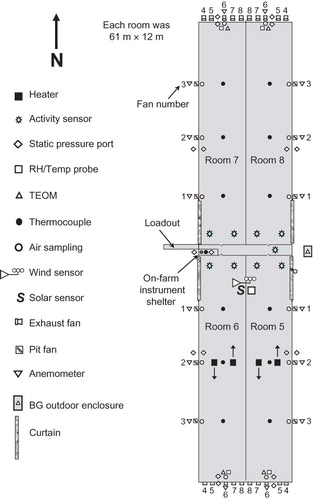
Figure 3. South-end view of barn 2, showing some of the measurement locations.
Table 1. Fan numbers and ventilation stages for the finishing rooms
Table 2. Characteristics of the finishing barns
Table 3. Gas concentration data validation and interpolation requirements
Figure 4. Effects of the zero/span gas challenge line and loaded filter after one-month's exposure at average PM10 concentration of 625 μg/m3, on the analyzer response time for (a) NH3, (b) H2S, (c) CH4, and (d) CO2.
Figure 5. Responses of CH4 using 55C analyzer (calibration gas of 230 ppm, tested on November 14, 2008) and NH3 using the PAMGA analyzer (calibration gas of 36 ppm, tested on January 9, 2009) at fan 6 sampling location of room 7.
Table 4. Effects of the PAMGA's sample integration time (SIT) on gas measurements
Figure 6. Results of pairwise TEOM collocation for PM2.5 (top), PM10 (center) and TSP (bottom).
Figure 7. Response of thermocouple check using ice-water and hot-water baths at location fan 1 sampling location of room 5.
Figure 8. Results of zero checks of dP sensors in rooms 5 and 6.
Figure 9. Manure depths measured in the manure pit. Each arrow indicates manure load-out.