Figures & data
Table 1. Chemical composition of the end-of-life CRT funnel glass analyzed by X-ray fluorescence (XRF)
Figure 1. SEM images of CRT funnel glass after mechanical activation for 2 hr at different rotational speeds under an ambient atmosphere: (A) raw material; (B) 100 rpm; (C) 300 rpm; (D) 500 rpm; (E) 700 rpm.
Figure 2. X-ray diffraction patterns of raw material and 120-min-activated CRT funnel glass at different rotational speeds.
Figure 3. Dependence of recovery rate of major elements on milling rotational speed, under the following conditions: leaching temperature of 95 °C, HNO3 concentration 3 mol/L, and leaching time of 1 hr.
Figure 4. Dependence of recovery rate of major elements on activation time, under the following conditions: leaching temperature at 95 °C, HNO3 concentration 3 mol/L, and leaching time of 1 hr.
Figure 5. Dependence of recovery rate of major elements on the leaching temperature, under the following conditions: leaching time of 1 hr and HNO3 concentration 3 mol/L.
Figure 6. Dependence of recovery rate of major elements on the acid concentration, under the following conditions: leaching time for 1 hr and temperature at 95 °C.
Figure 7. Dependence of recovery rate of major elements on the liquid-to-solid ratio, under the following conditions: HNO3 concentration 3 mol/L, leaching time of 1 hr, and temperature at 95 °C.
Figure 8. Dependence of recovery rate of major elements on the leaching time, under the following conditions: HNO3 concentration 3 mol/L and leaching temperature at 80 °C.
Figure 9. Photo and XRD pattern of residue after leaching in 3 mol/L HNO3 at 95 °C for 1 hr (L/S = 150). (Color figure available online).
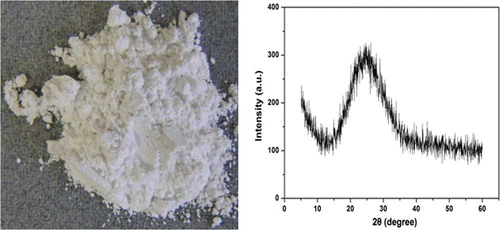
Figure 10. O1s, Si2p, and Pb4f spectra of unactivated, activated, and leached samples.