1,375
Views
16
CrossRef citations to date
0
Altmetric
Technical Papers

A framework for emissions source apportionment in industrial areas: MM5/CALPUFF in a near-field application

&
Pages 190-204 | Published online: 23 Jan 2013

Figures & data

Table 1. Characteristics of the main plants in the study areaFootnote a

Table 2. Physical characteristics of modeled source groups

Figure 1. Characteristics of the study area (colour figure avilable in online).

Figure 1. Characteristics of the study area (colour figure avilable in online).

Table 3. Summary of field monitoring campaign for CO, NO2, and PM1 0

Table 4. Range of emission factors (g/sec)

Table 5. Statistical analysis of model simulations against field measurements for CO and NO2

Table 6. Statistical analysis of model simulations against field measurements for PM10

Figure 2. Selected (a) scatter and (b) Q-Q plots for CO (µg/m3), NO2 (µg/m3), and PM10 (µg/m3).

Figure 2. Selected (a) scatter and (b) Q-Q plots for CO (µg/m3), NO2 (µg/m3), and PM10 (µg/m3).

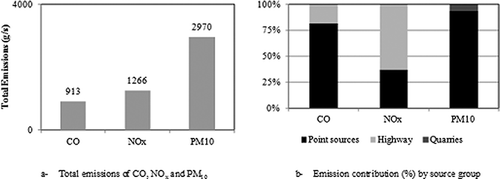
Figure 3. Emission characteristics in the study area.

Figure 3. Emission characteristics in the study area.

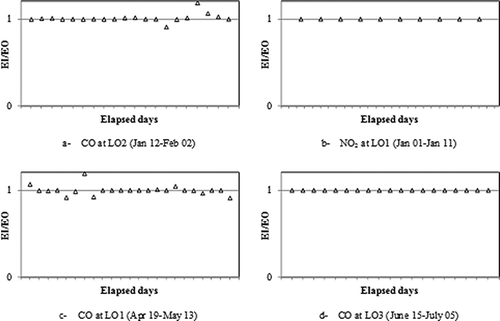
Figure 4. Ratio of the 24-hr average concentration predicted via the EI and EO scenarios.

Figure 4. Ratio of the 24-hr average concentration predicted via the EI and EO scenarios.

Table 7. Source contribution to the highest weekly average CO concentration

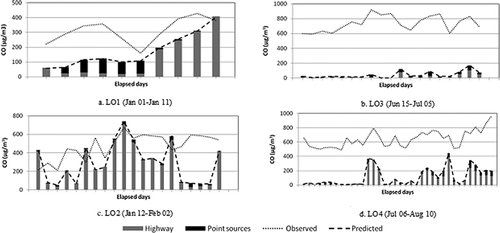
Figure 5. Typical daily source contribution to CO concentration (µg/m3) at several locations.

Figure 5. Typical daily source contribution to CO concentration (µg/m3) at several locations.

Figure 6. Spatial distribution of the 24-hr average CO concentration during winter and summer (colour figure avilable in online).
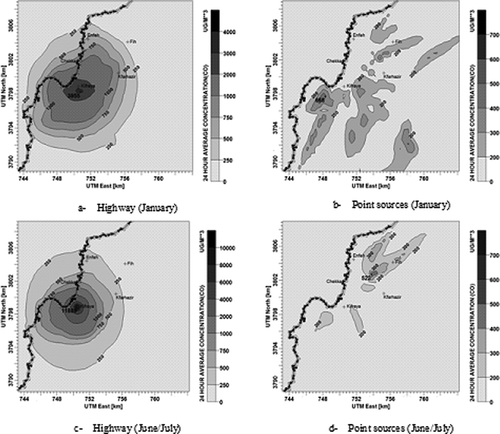
Figure 6. Spatial distribution of the 24-hr average CO concentration during winter and summer (colour figure avilable in online).

Table 8. Source contribution to the highest weekly average NO2 concentration

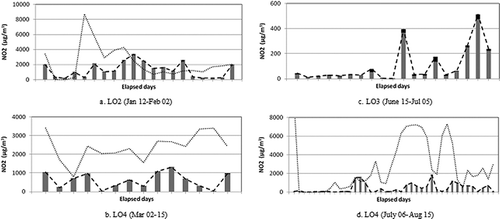
Figure 7. Typical daily source contribution to NO2 concentration at several locations.

Figure 7. Typical daily source contribution to NO2 concentration at several locations.

Figure 8. Spatial distribution of the 24-hr average NO2 concentration during winter and summer (colour figure avilable in online).
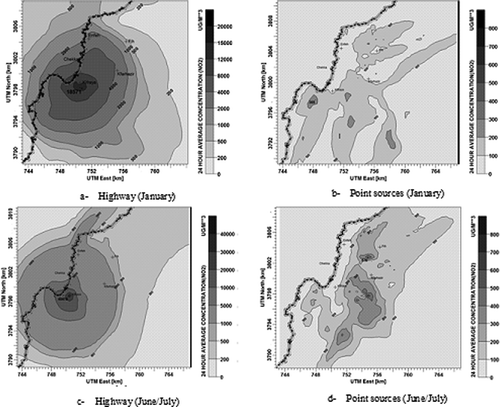
Figure 8. Spatial distribution of the 24-hr average NO2 concentration during winter and summer (colour figure avilable in online).

Figure 9. Spatial distribution of the 24-hr average PM10 concentration during summer (colour figure avilable in online).
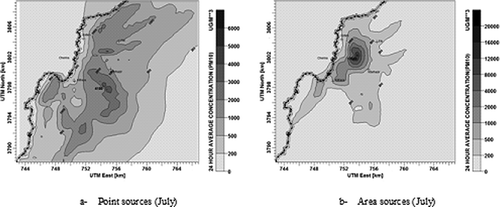
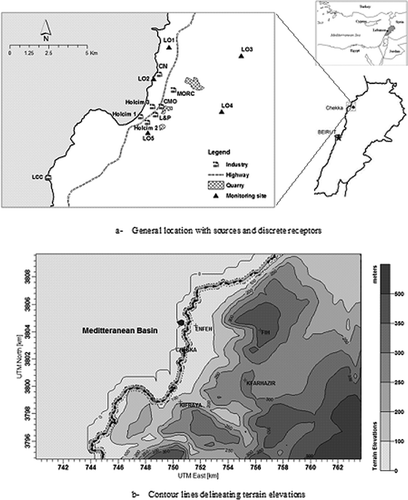
Figure 9. Spatial distribution of the 24-hr average PM10 concentration during summer (colour figure avilable in online).
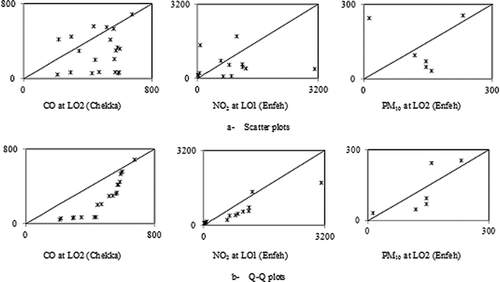
Figure 10. Time series of NO2 concentration with and without chemical transformations.

Figure 10. Time series of NO2 concentration with and without chemical transformations.

Reprints and Corporate Permissions

Please note: Selecting permissions does not provide access to the full text of the article, please see our help page How do I view content?

To request a reprint or corporate permissions for this article, please click on the relevant link below:

Academic Permissions

Please note: Selecting permissions does not provide access to the full text of the article, please see our help page How do I view content?

Obtain permissions instantly via Rightslink by clicking on the button below:

If you are unable to obtain permissions via Rightslink, please complete and submit this Permissions form. For more information, please visit our Permissions help page.