767
Views
1
CrossRef citations to date
0
Altmetric
Technical Papers

Statistical techniques for analyzing of soil vapor intrusion data: A case study of manufactured gas plant sites

, , , , , & show all
Pages 219-229 | Published online: 23 Jan 2013

Figures & data

Figure 1. Reporting limits for censored data in indoor air samples. Dotted black line represents U.S. EPA BASE 50th percentile values; solid gray line represents 50th percentile values from NYSDOH study; dashed black line represents median LOQ in U.S. EPA study; and dashed gray line represent laboratory detection limit in NYSDOH study (LOQ, limits of quantitation; EPA 50, EPA 50th percentile value; DOH 50, 50th percentile value from NYSDOH study.) Figure generated using lattice package in R (Sarkar, 2008).

Figure 1. Reporting limits for censored data in indoor air samples. Dotted black line represents U.S. EPA BASE 50th percentile values; solid gray line represents 50th percentile values from NYSDOH study; dashed black line represents median LOQ in U.S. EPA study; and dashed gray line represent laboratory detection limit in NYSDOH study (LOQ, limits of quantitation; EPA 50, EPA 50th percentile value; DOH 50, 50th percentile value from NYSDOH study.) Figure generated using lattice package in R (Sarkar, 2008).

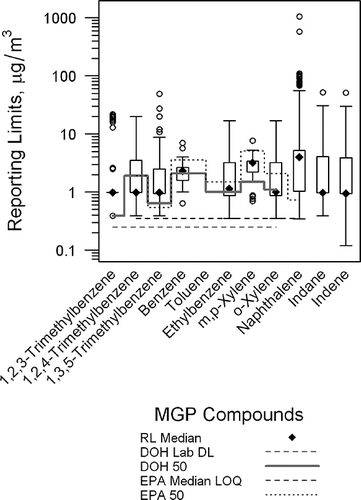
Table 1. Variations of statistical methods used in this work

Table 2. Sample characteristics for MGP-VI database (N = number of samples, RL = reporting limit in μg/m3)

Figure 2. Bootstrap distributions for different hypothesis tests (case B-III). Figure generated using lattice package in R (Sarkar, 2008).

Figure 2. Bootstrap distributions for different hypothesis tests (case B-III). Figure generated using lattice package in R (Sarkar, 2008).

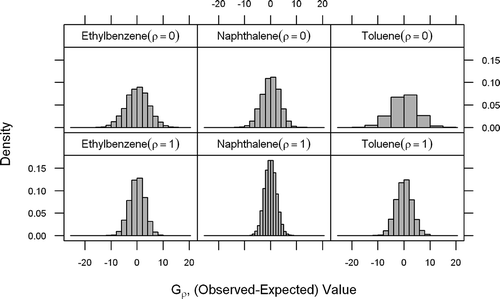
Table 3a. Summary of selected statistical computations for 50th percentile concentration (all concentration values and confidence limits are expressed in μg/m3; percentile values in μg/m3 using substitution method [SUB-A] and by rejecting censored data appear [REJ-A] below the names of the compound)

Table 3b. Summary of selected statistical computations for 90th percentile concentration (all concentration values and confidence limits are expressed in μg/m3; percentile values in μg/m3 using substitution method [SUB-A] and by rejecting censored data [REJ-A] appear below the names of the compound)

Table 4. Results of hypothesis test to compare MGP with U.S. EPA BASE data (G ρ values are for EPA BASE group; p-values based on 5000 repetitions)

Supplemental material

Supplemental Materials

Download Zip (864.5 KB)

Reprints and Corporate Permissions

Please note: Selecting permissions does not provide access to the full text of the article, please see our help page How do I view content?

To request a reprint or corporate permissions for this article, please click on the relevant link below:

Academic Permissions

Please note: Selecting permissions does not provide access to the full text of the article, please see our help page How do I view content?

Obtain permissions instantly via Rightslink by clicking on the button below:

If you are unable to obtain permissions via Rightslink, please complete and submit this Permissions form. For more information, please visit our Permissions help page.