1,141
Views
16
CrossRef citations to date
0
Altmetric
Technical Paper

Field study and source attribution for PM2.5 and PM10 with resulting reduction in concentrations in the neighborhood north of the Houston Ship Channel based on voluntary efforts

, , , , &
Pages 1070-1082 | Published online: 20 Aug 2013

Figures & data

Figure 1. Google Earth map of the Clinton Drive monitoring site location and the surrounding area.

Figure 1. Google Earth map of the Clinton Drive monitoring site location and the surrounding area.

Figure 2. Quarterly mean PM2.5 concentration at Clinton Drive from FRM filter samples.

Figure 2. Quarterly mean PM2.5 concentration at Clinton Drive from FRM filter samples.

Figure 3. Quarterly mean PM10 concentration at Clinton Drive from HiVol filter samples.

Figure 3. Quarterly mean PM10 concentration at Clinton Drive from HiVol filter samples.

Figure 4. Mean TEOM (not an FEM) PM2.5 concentration at Clinton Drive compared with other sites, calendar year 2006.
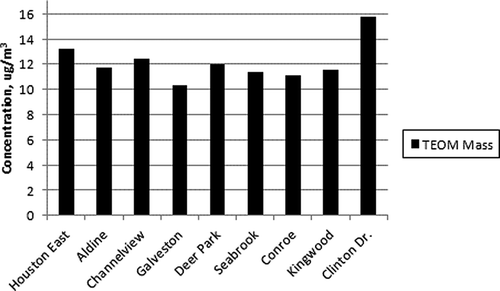
Figure 4. Mean TEOM (not an FEM) PM2.5 concentration at Clinton Drive compared with other sites, calendar year 2006.

Figure 5. Mean reconstructed soil component at Clinton Drive, summer 2006, compared with other sites from summer 2005.
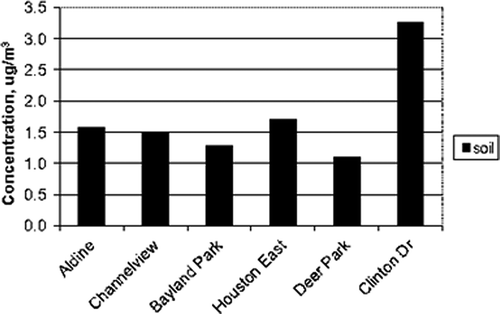
Figure 5. Mean reconstructed soil component at Clinton Drive, summer 2006, compared with other sites from summer 2005.

Figure 6. Map of monitoring sites for PM2.5 in 2006 used in intercomparisons.

Figure 6. Map of monitoring sites for PM2.5 in 2006 used in intercomparisons.

Figure 7. Teflon filter 2005–2006 average composition—121 days with a predominant wind direction, 15 North African dust days, and 1 fireworks day, December 31, 2006.
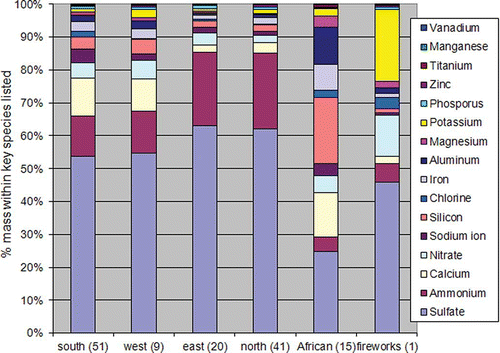
Figure 7. Teflon filter 2005–2006 average composition—121 days with a predominant wind direction, 15 North African dust days, and 1 fireworks day, December 31, 2006.

Figure 8. Wind directionality for “calcium & sulfate” factor (μg/m3) on 57 days used in early PMF analysis.
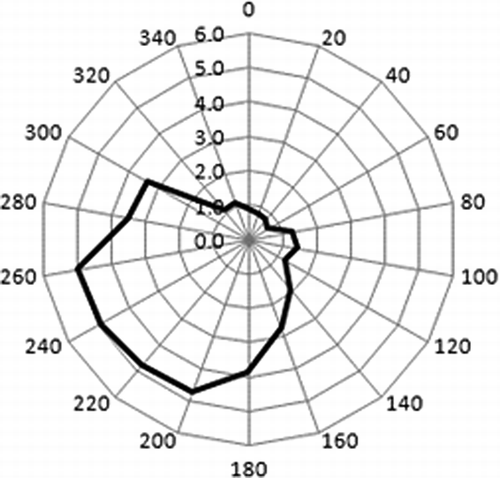
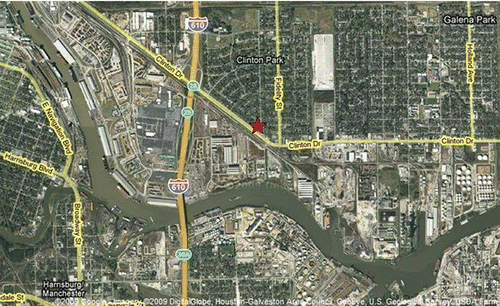
Figure 8. Wind directionality for “calcium & sulfate” factor (μg/m3) on 57 days used in early PMF analysis.
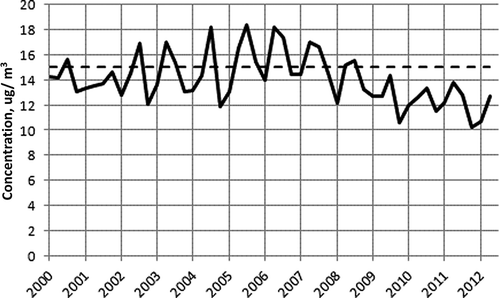
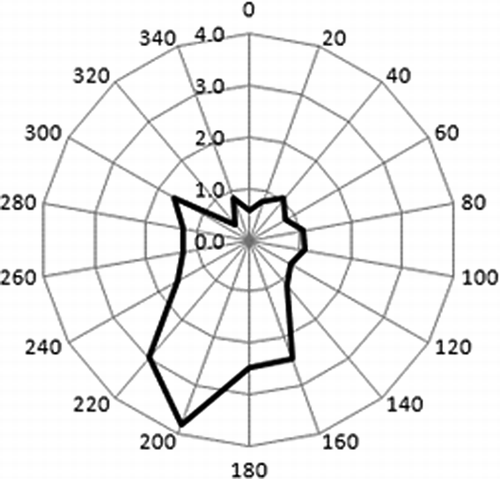
Figure 9. Wind directionality for “soil” factor (μg/m3) on 57 days used in early PMF analysis.
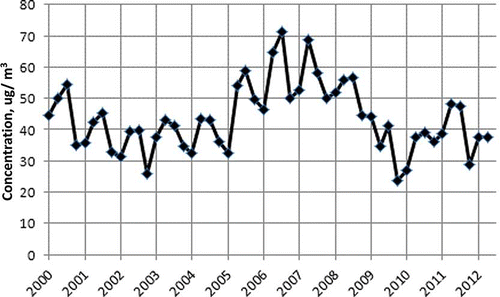
Figure 9. Wind directionality for “soil” factor (μg/m3) on 57 days used in early PMF analysis.
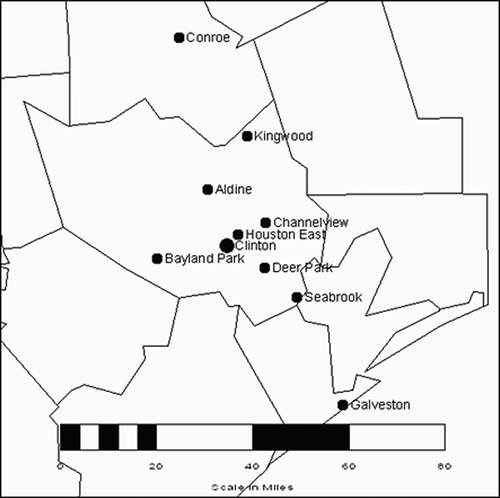
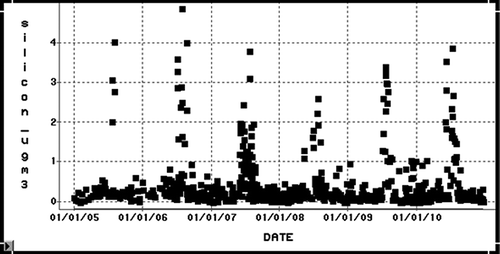
Figure 10. Silicon concentrations at Clinton Drive, 2005–2010, all unflagged data, 612 samples.

Figure 10. Silicon concentrations at Clinton Drive, 2005–2010, all unflagged data, 612 samples.

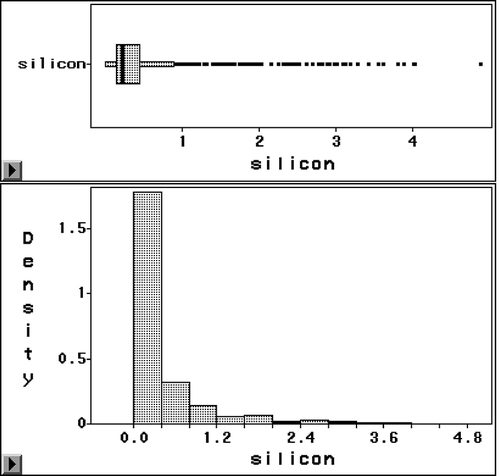
Figure 11. Histogram for the distribution of silicon values at Clinton Drive, 2005–2010.

Figure 11. Histogram for the distribution of silicon values at Clinton Drive, 2005–2010.

Table 1. Mean ratios of crustal elements to silicon from six PM2.5 speciation sites in three urban areas, North African dust versus other days, and paired t test for differences

Table 2. Ten factors derived with PMF version 3.0 using Clinton Drive data

Table 3. Ten factors’ contribution to total mass at Clinton Drive, 2005–2012

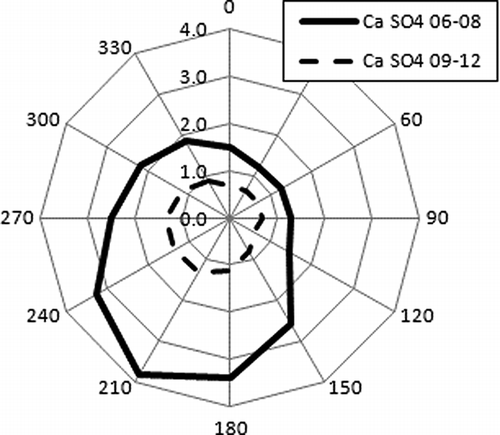
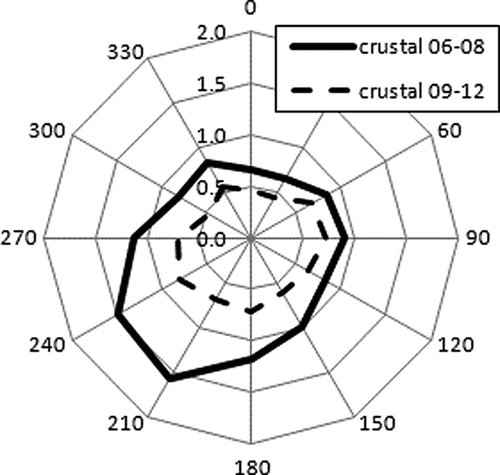
Figure 12. Calcium sulfate factor (μg/m3) in 2006–2008 and 2009–2012 by 30˚ wind bin.

Figure 12. Calcium sulfate factor (μg/m3) in 2006–2008 and 2009–2012 by 30˚ wind bin.

Figure 13. Soil/crustal factor (μg/m3) in 2006–2008 and 2009–2012 by 30˚ wind bin.

Figure 13. Soil/crustal factor (μg/m3) in 2006–2008 and 2009–2012 by 30˚ wind bin.

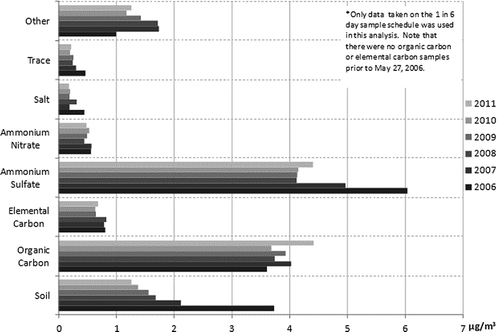
Figure 14. Annual average PM2.5 DRI reconstructed species concentrations (*see figure) at Clinton Drive.

Figure 14. Annual average PM2.5 DRI reconstructed species concentrations (*see figure) at Clinton Drive.

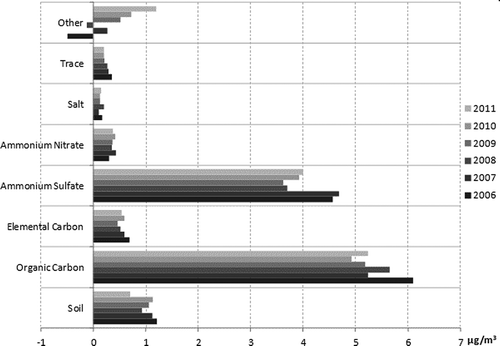
Figure 15. Annual average PM2.5 DRI reconstructed species concentrations at Aldine.

Figure 15. Annual average PM2.5 DRI reconstructed species concentrations at Aldine.

Reprints and Corporate Permissions

Please note: Selecting permissions does not provide access to the full text of the article, please see our help page How do I view content?

To request a reprint or corporate permissions for this article, please click on the relevant link below:

Academic Permissions

Please note: Selecting permissions does not provide access to the full text of the article, please see our help page How do I view content?

Obtain permissions instantly via Rightslink by clicking on the button below:

If you are unable to obtain permissions via Rightslink, please complete and submit this Permissions form. For more information, please visit our Permissions help page.