Figures & data
Table 1. Monitor performance specifications for O3 based in 40 CFR Part 53
Table 2. Variables routinely measured at the Houston site
Table 3. Specifications of O3 monitors used in this study
Figure 1. Comparison of rolling 8-hr averages from three O3 monitors.
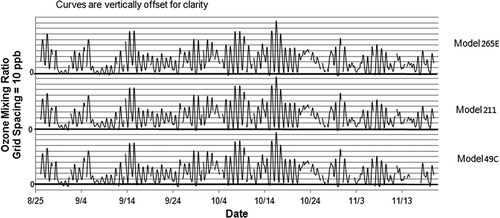
Figure 2. Daily maximum 8-hr O3 average reported by three O3 monitors relative to three O3 levels.
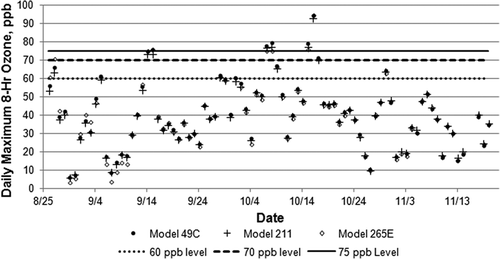
Figure 3. Differences in daily maximum 8-hr O3 average between the new and conventional monitors.
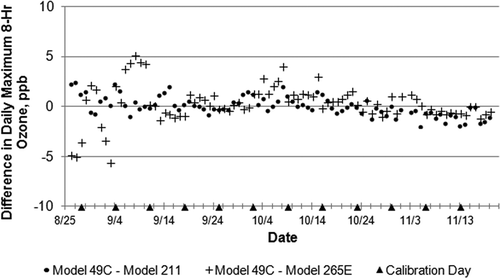
Table 4. Summary of rolling 8-hr O3 averages during the study (excluding August 26–27)
Figure 4. Ranked 8-hr ozone averages for all periods when at least one monitor exceeded 60 ppb (arrows indicate data from August 26–27).
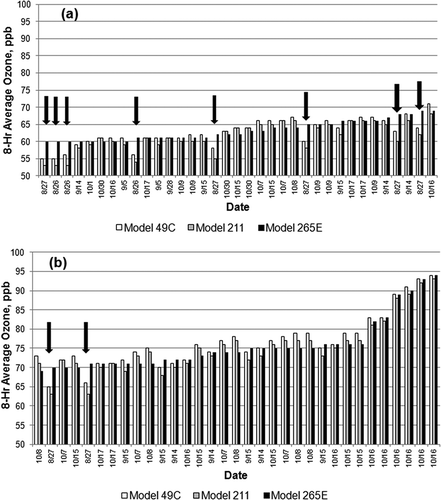
Table 5. Effect of the application of QA/QC results on model 211 rolling 8-hr average O3 data parameters
Figure 5. Difference in daily maximum 8-hour O3 average between the model 49C and model 211 monitors before and after daily zero/span adjustment.
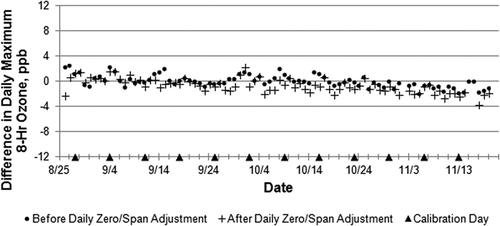
Figure 6. Difference in daily maximum 8-hr O3 average between the model 49C and the model 265E monitors before and after daily zero/span adjustment.
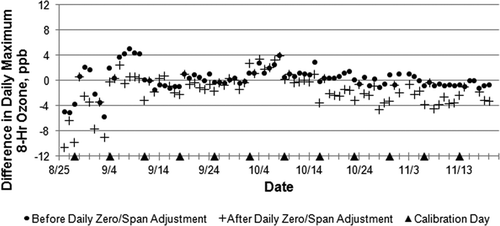
Figure 7. Comparison of maximum daily 8-hr O3 average among three monitors for the four highest O3 days.
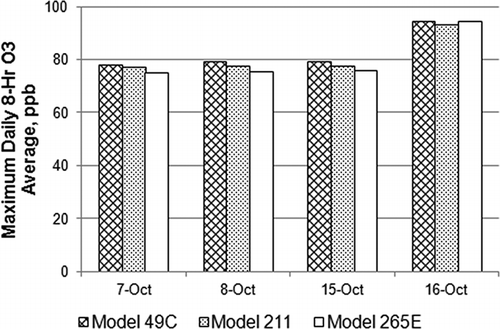
Figure 8. Response of O3 monitors to VOC mixture containing aromatic hydrocarbons.
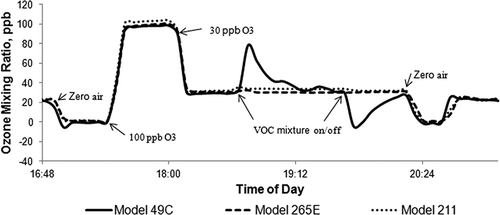
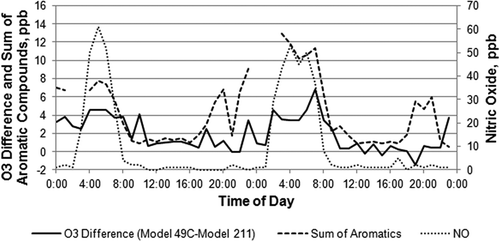
Figure 9. Time series of hourly O3 difference (model 49C minus model 211), sum of aromatic species and nitric oxide for October 16–17.