1,319
Views
7
CrossRef citations to date
0
Altmetric
Technical Paper

Estimating surface visibility at Hong Kong from ground-based LIDAR, sun photometer and operational MODIS products

, , , &
Pages 1098-1110 | Published online: 20 Aug 2013

Figures & data

Figure 1. Locations of the visibility monitoring stations in Hong Kong (HKO and HKPU are 0.5 km apart).
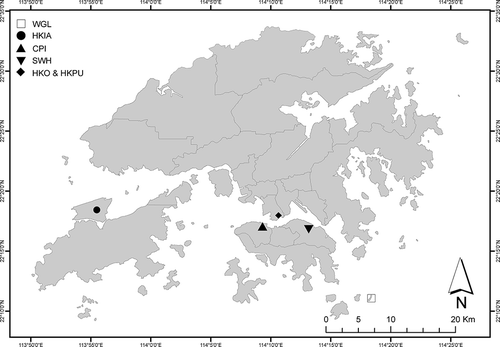
Figure 1. Locations of the visibility monitoring stations in Hong Kong (HKO and HKPU are 0.5 km apart).

Table 1.  Summary statistics for hourly averages of visibility, LIDAR AOD, AERONET AOD, extinction coefficient, and ML heights presenting sample size (N), mean, median, standard deviation (SD), and maximum/minimum (Max/Min)

Figure 2. Frequency distribution hourly averages of (a) ML-Low, (b) ML-High, (c) AOD from AERONET, (d) AOD from ALS, (e) visibility at HKIA, (f) visibility at HKPU, and (g) extinction coefficient from ALS for height between 75 and 150 m.
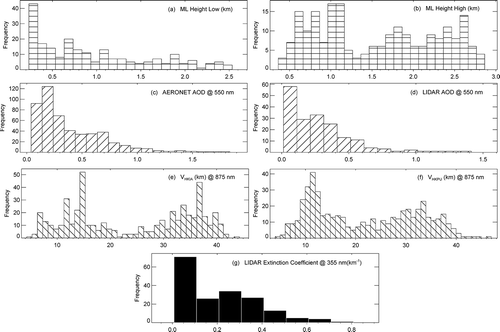
Figure 2. Frequency distribution hourly averages of (a) ML-Low, (b) ML-High, (c) AOD from AERONET, (d) AOD from ALS, (e) visibility at HKIA, (f) visibility at HKPU, and (g) extinction coefficient from ALS for height between 75 and 150 m.

Figure 3. Relationship between visibility at HKPU derived from visibility meter at the 875 nm wavelength and (a) AOD from AERONET, (b) AOD from ALS, (c) ML-Low, and (d) extinction coefficient from ALS for height between 75 and 150 m at HKPU. Here R is correlation and N is the number of data points.
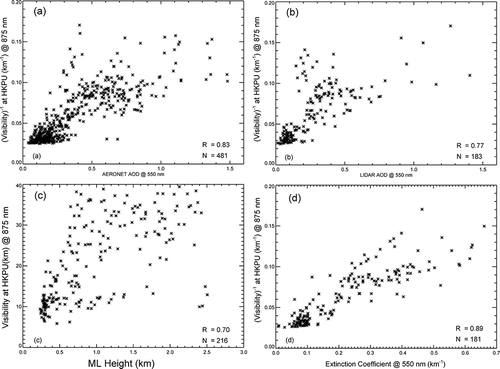
Figure 3. Relationship between visibility at HKPU derived from visibility meter at the 875 nm wavelength and (a) AOD from AERONET, (b) AOD from ALS, (c) ML-Low, and (d) extinction coefficient from ALS for height between 75 and 150 m at HKPU. Here R is correlation and N is the number of data points.

Table 2.  Proposed models for estimating extinction coefficient of MODIS at HKIA (σMA) and VHKIA

Figure 4. Nonlinear regression fit for scaled extinction coefficient and visibility at HKPU. Estimated values of the regression coefficients a and b and N are reported along with root mean square error (RMSE), mean absolute deviation (MAD), and coefficient of determination (R 2) for 165 measured values of visibility at HKPU and scaled surface extinction coefficient.
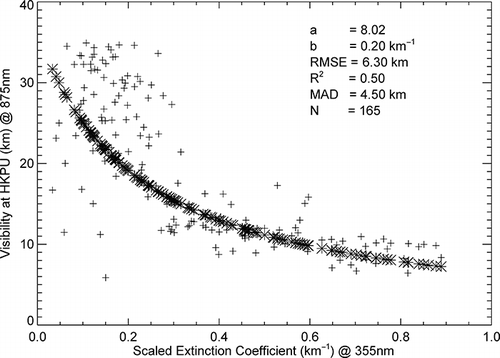
Figure 4. Nonlinear regression fit for scaled extinction coefficient and visibility at HKPU. Estimated values of the regression coefficients a and b and N are reported along with root mean square error (RMSE), mean absolute deviation (MAD), and coefficient of determination (R 2) for 165 measured values of visibility at HKPU and scaled surface extinction coefficient.

Figure 5. MODIS derived modeled visibility at HKIA from the proposed models listed in and actual visibility (histogram bars) from visibility meter at HKIA. In addition to MODIS AOD, Model 1–4 uses AOD, ML heights, as well as extinction coefficients from ground-based instruments at HKPU, whereas Models 5 and 6 use visibility readings from visibility meter at HKPU. Error bars are ±20% of the visibility at HKIA from the manual of visibility meter.
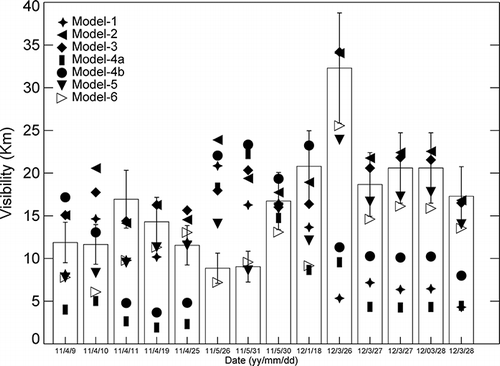
Figure 5. MODIS derived modeled visibility at HKIA from the proposed models listed in Table 1 and actual visibility (histogram bars) from visibility meter at HKIA. In addition to MODIS AOD, Model 1–4 uses AOD, ML heights, as well as extinction coefficients from ground-based instruments at HKPU, whereas Models 5 and 6 use visibility readings from visibility meter at HKPU. Error bars are ±20% of the visibility at HKIA from the manual of visibility meter.

Figure 6. Scatter plot of V HKIA and MODIS derived visibility at HKIA for each proposed model (). Dashed line displays the 1:1 line and dashed rectangle encompasses the data for 26 May 2011 and 31 May 2011. R 2, RMSE, and MAD are described in Figure 4.
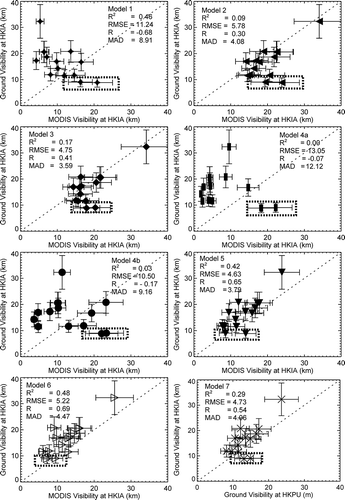
Figure 6. Scatter plot of V HKIA and MODIS derived visibility at HKIA for each proposed model (Table 1). Dashed line displays the 1:1 line and dashed rectangle encompasses the data for 26 May 2011 and 31 May 2011. R 2, RMSE, and MAD are described in Figure 4.

Table 3.  Comparison of model's performances before and after removal of data for 26 May 2011 and 31 May 2011

Figure 7. Scatter plot of V HKIA and MODIS derived visibility at HKIA for Models 4–6 with extended validation data sets. Dashed line displays the 1:1 line. R 2, RMSE, and MAD are described in Figure 4 and N is the available number of data points for validation.
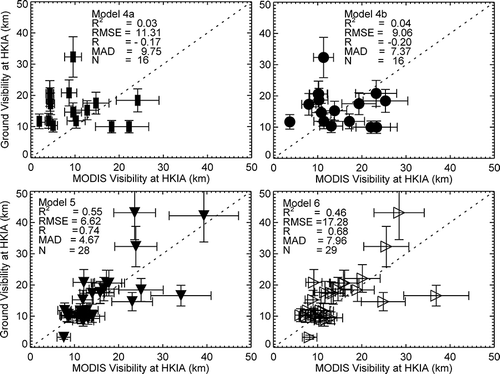
Figure 7. Scatter plot of V HKIA and MODIS derived visibility at HKIA for Models 4–6 with extended validation data sets. Dashed line displays the 1:1 line. R 2, RMSE, and MAD are described in Figure 4 and N is the available number of data points for validation.

Figure 8. Pattern statistics (Taylor diagram; CitationTaylor, 2001) describing the visibilities from the six models compared with observed visibilities at HKIA. The radial distance from the origin at “0.0” represents the normalized standard deviation. “Obs” represents the statistics of observed visibilities at HKIA. RMS difference for the modeled visibilities is proportional to the radial distances from origin at “Obs” (units same as normalized standard deviation). Normalized Pearson's correlation between observed and modeled visibilities is represented along the azimuthal position along the outer hemisphere. Color bar scales the normalized bias (%) in each model (color figure available online).
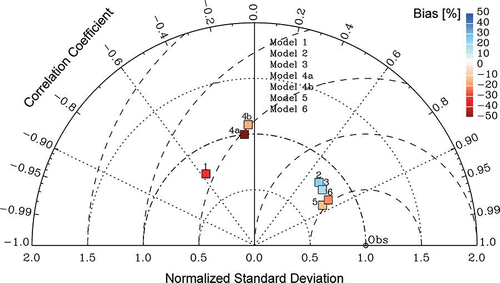
Figure 8. Pattern statistics (Taylor diagram; CitationTaylor, 2001) describing the visibilities from the six models compared with observed visibilities at HKIA. The radial distance from the origin at “0.0” represents the normalized standard deviation. “Obs” represents the statistics of observed visibilities at HKIA. RMS difference for the modeled visibilities is proportional to the radial distances from origin at “Obs” (units same as normalized standard deviation). Normalized Pearson's correlation between observed and modeled visibilities is represented along the azimuthal position along the outer hemisphere. Color bar scales the normalized bias (%) in each model (color figure available online).

Reprints and Corporate Permissions

Please note: Selecting permissions does not provide access to the full text of the article, please see our help page How do I view content?

To request a reprint or corporate permissions for this article, please click on the relevant link below:

Academic Permissions

Please note: Selecting permissions does not provide access to the full text of the article, please see our help page How do I view content?

Obtain permissions instantly via Rightslink by clicking on the button below:

If you are unable to obtain permissions via Rightslink, please complete and submit this Permissions form. For more information, please visit our Permissions help page.