947
Views
12
CrossRef citations to date
0
Altmetric
Technical Paper

Space-time analysis of the Air Quality Model Evaluation International Initiative (AQMEII) Phase 1 air quality simulations

, , , &
Pages 388-405 | Received 15 Jan 2013, Accepted 27 May 2013, Published online: 14 Mar 2014

Figures & data

Table 1. List of modeling systems analyzed in this study

Table 2. Frequency of occurrence of the different synoptic patterns for the E. NA, W. NA, and EU map typing domains

Table 3. Definition of analysis regions for stratifying operational model performance based on synoptic patterns

Figure 1. Box-and-whisker plots of RMSE and MBE for NE and N. EU domains for each model and each pattern. The all-pattern results are also shown for each model. Boxes-and-whiskers represent the distribution of RMSE and MBE across the monitoring sites in the analysis domains. On either side of the box, the whiskers extend to the most extreme data point or 1.5 times the interquartile range (i.e., the difference between the 25th and 75th percentiles), whichever is less.
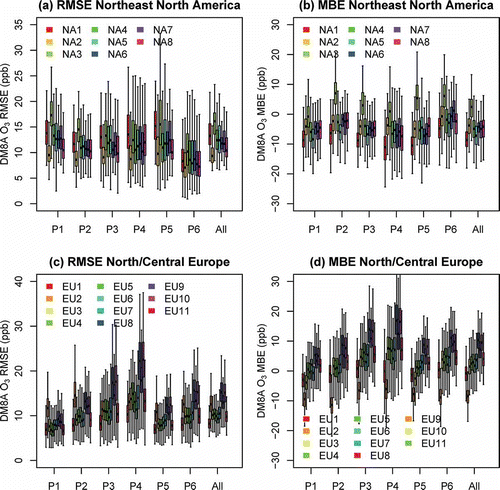
Figure 1. Box-and-whisker plots of RMSE and MBE for NE and N. EU domains for each model and each pattern. The all-pattern results are also shown for each model. Boxes-and-whiskers represent the distribution of RMSE and MBE across the monitoring sites in the analysis domains. On either side of the box, the whiskers extend to the most extreme data point or 1.5 times the interquartile range (i.e., the difference between the 25th and 75th percentiles), whichever is less.

Table 4. (a) RMSE and (b) MBE of DM8A ozone for each synoptic pattern for the three analysis regions in the eastern NA map typing domain

Table 5. (a) RMSE and (b) MBE of DM8A ozone for each synoptic pattern for the three analysis regions in the western NA map typing domain

Table 6. (a) RMSE and (b) MBE of DM8A ozone for each synoptic pattern for the two analysis regions in the EU map typing domain

Figure 2. RMSE of DM8A ozone for different models over the eastern NA map typing domain as a function of (a) pattern average cloud fraction, (b) pattern short-wave radiation anomalies, (c) pattern 2-m temperature anomalies, and (d) pattern average wind speed.
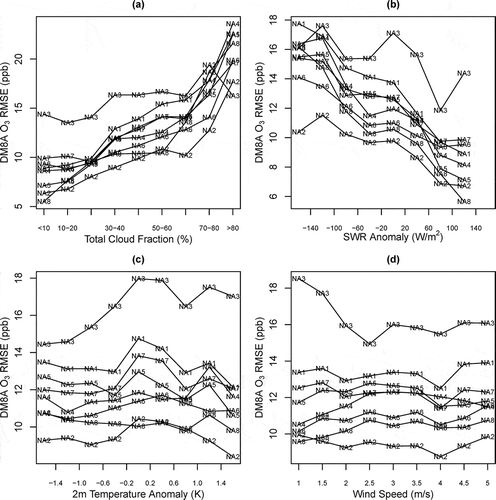
Figure 2. RMSE of DM8A ozone for different models over the eastern NA map typing domain as a function of (a) pattern average cloud fraction, (b) pattern short-wave radiation anomalies, (c) pattern 2-m temperature anomalies, and (d) pattern average wind speed.

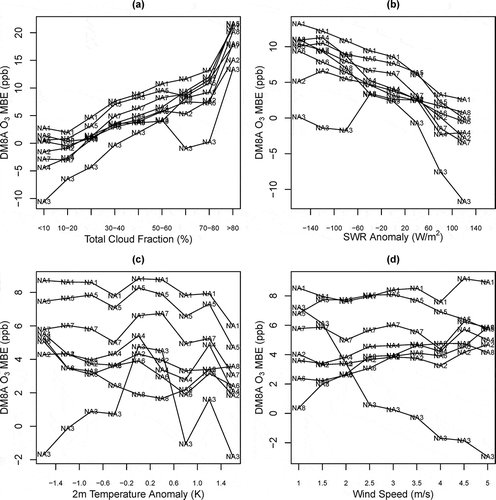
Figure 3. As Figure 2, but for MBE rather than RMSE.

Figure 3. As Figure 2, but for MBE rather than RMSE.

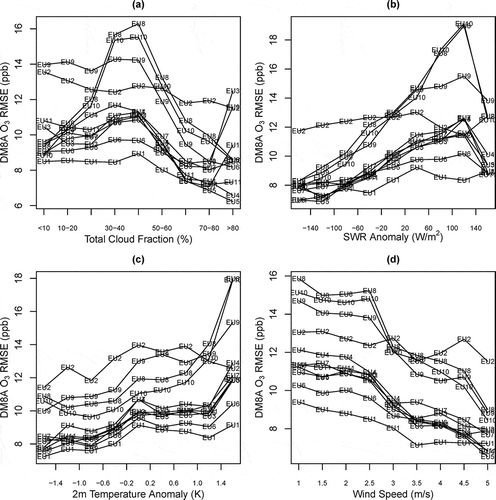
Figure 4. As Figure 2, but for the EU rather than the eastern NA map typing domain.

Figure 4. As Figure 2, but for the EU rather than the eastern NA map typing domain.

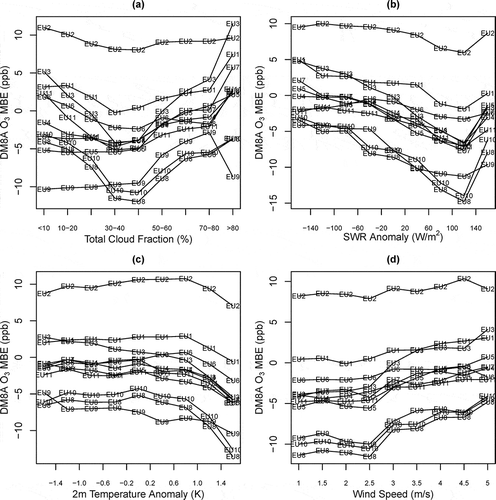
Figure 5. As Figure 4, but for MBE rather than RMSE.

Figure 5. As Figure 4, but for MBE rather than RMSE.

Figure 6. Power spectra of observations, regional model simulations, and global model simulations used as boundary conditions for most regional model simulations. The power spectra were calculated separately at each site and then averaged over all sites. (a) NA, (b) EU.
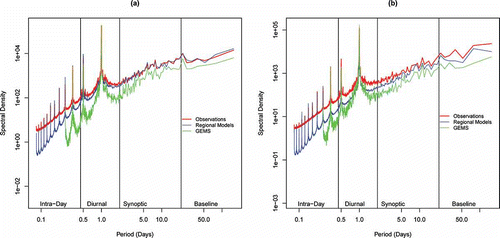
Figure 6. Power spectra of observations, regional model simulations, and global model simulations used as boundary conditions for most regional model simulations. The power spectra were calculated separately at each site and then averaged over all sites. (a) NA, (b) EU.

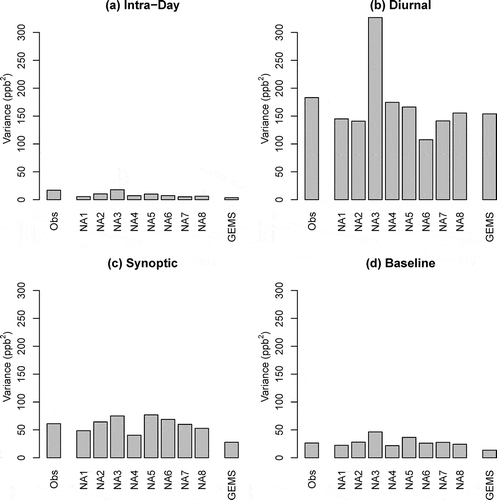
Figure 7. Bar charts of component variances—NA.

Figure 7. Bar charts of component variances—NA.

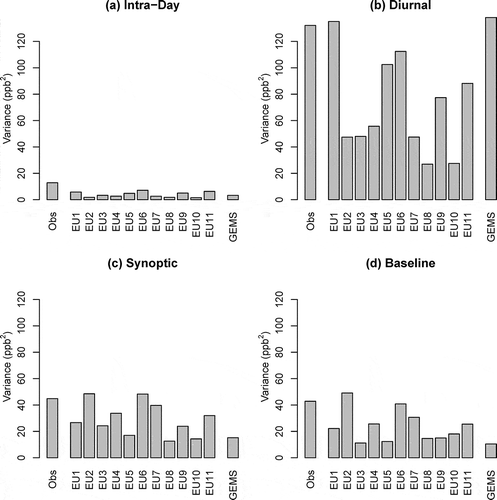
Figure 8. Bar charts of component variances—EU.

Figure 8. Bar charts of component variances—EU.

Figure 9. Box-and-whisker plots of correlation coefficients between observations and model simulations for different temporal components. (a) NA, (b) EU. On either side of the box, the whiskers extend to the most extreme data point or 1.5 times the interquartile range (i.e., the difference between the 25th and 75th percentiles), whichever is less.
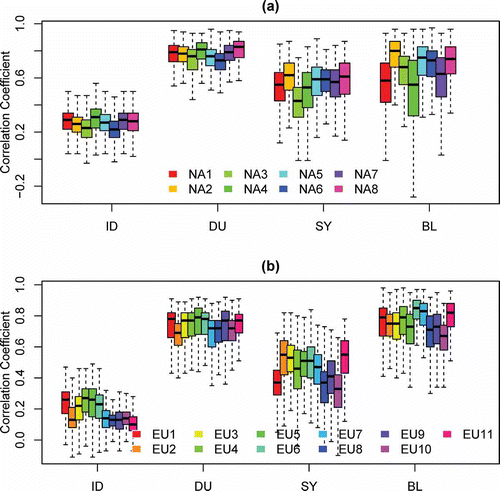
Figure 9. Box-and-whisker plots of correlation coefficients between observations and model simulations for different temporal components. (a) NA, (b) EU. On either side of the box, the whiskers extend to the most extreme data point or 1.5 times the interquartile range (i.e., the difference between the 25th and 75th percentiles), whichever is less.

Table 7. RMSE and correlation coefficient at regionally representative and locally influenced sites over (a) NA and (b) EU

Table 8. RMSE and correlation coefficient at rural, suburban, and urban sites over (a) NA and (b) EU

Figure 10. Box-and-whisker plots of observed and simulated e-folding distances at regionally representative and locally influenced sites as defined in the text. (a) Locally influenced sites, NA; (b) regionally representative sites, NA; (c) locally influenced sites, EU; (d) regionally representative sites, EU. On either side of the box, the whiskers extend to the most extreme data point or 1.5 times the interquartile range (i.e., the difference between the 25th and 75th percentiles), whichever is less. The dashed line represents the median observed e-folding distance.
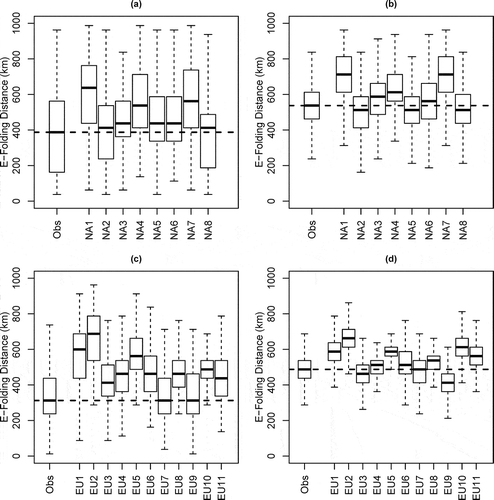
Figure 10. Box-and-whisker plots of observed and simulated e-folding distances at regionally representative and locally influenced sites as defined in the text. (a) Locally influenced sites, NA; (b) regionally representative sites, NA; (c) locally influenced sites, EU; (d) regionally representative sites, EU. On either side of the box, the whiskers extend to the most extreme data point or 1.5 times the interquartile range (i.e., the difference between the 25th and 75th percentiles), whichever is less. The dashed line represents the median observed e-folding distance.
Supplemental material

Supplemental Material

Download PDF (3.2 MB)

Reprints and Corporate Permissions

Please note: Selecting permissions does not provide access to the full text of the article, please see our help page How do I view content?

To request a reprint or corporate permissions for this article, please click on the relevant link below:

Academic Permissions

Please note: Selecting permissions does not provide access to the full text of the article, please see our help page How do I view content?

Obtain permissions instantly via Rightslink by clicking on the button below:

If you are unable to obtain permissions via Rightslink, please complete and submit this Permissions form. For more information, please visit our Permissions help page.