1,891
Views
8
CrossRef citations to date
0
Altmetric
Technical Paper

Toward verifying fossil fuel CO2 emissions with the CMAQ model: Motivation, model description and initial simulation

, , , , , , , , , , , , & show all
Pages 419-435 | Received 17 Jan 2013, Accepted 11 Jun 2013, Published online: 14 Mar 2014

Figures & data

Table 1. CO2 fluxes used in CMAQ simulations

Figure 1. Monthly mean NEE for October 2007 from (a) CT2011, (b) CASA (CT2011 prior), and (c) Community Land Model (CLM4VIC-BG1) in the model domain.
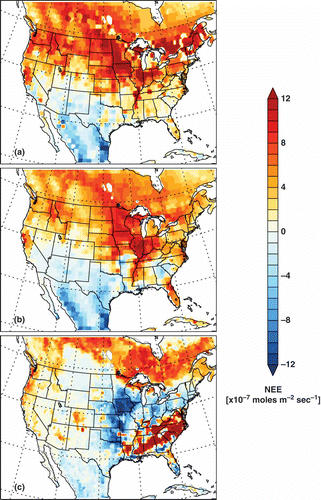
Figure 1. Monthly mean NEE for October 2007 from (a) CT2011, (b) CASA (CT2011 prior), and (c) Community Land Model (CLM4VIC-BG1) in the model domain.

Table 2. List of model sensitivity experiments

Figure 2. Monthly mean fossil-fuel CO2 emissions for October 2007 from (a) Vulcan and (b) CDIAC in the model domain.
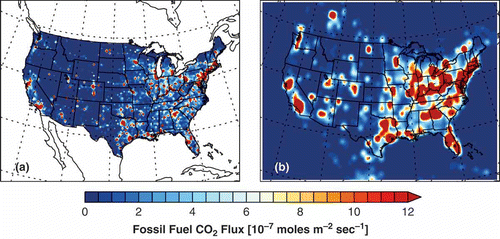
Figure 2. Monthly mean fossil-fuel CO2 emissions for October 2007 from (a) Vulcan and (b) CDIAC in the model domain.

Figure 3. Sensitivity of monthly mean net CO2 fluxes to choice of NEE, (a) CT2011 for VCT (“our standard model”), (b) CASA for VCS, and (c) Community Land Model 4VIC-BG1 for VCL. Fossil-fuel emissions (Vulcan inside the United States and CDIAC outside), fire emissions (GFED), and ocean fluxes (CT2011) are the same for the three model configurations.
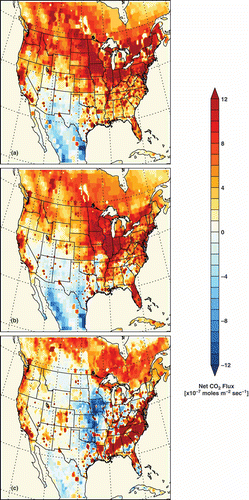
Figure 3. Sensitivity of monthly mean net CO2 fluxes to choice of NEE, (a) CT2011 for VCT (“our standard model”), (b) CASA for VCS, and (c) Community Land Model 4VIC-BG1 for VCL. Fossil-fuel emissions (Vulcan inside the United States and CDIAC outside), fire emissions (GFED), and ocean fluxes (CT2011) are the same for the three model configurations.

Figure 4. Monthly mean CO2 concentrations near the surface in October 2007 simulated by (a) CT2011, (b) DCT, and (c) VCT (“the standard run”).
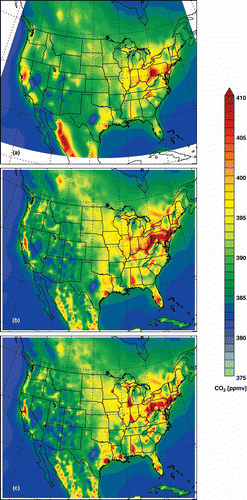
Figure 4. Monthly mean CO2 concentrations near the surface in October 2007 simulated by (a) CT2011, (b) DCT, and (c) VCT (“the standard run”).

Figure 5. Monthly mean CO2 produced by (a) the background model (BG), (b) biospheric sources only in the United States (BIO-BG), and (c) fossil-fuel sources only in the U.S. (FF-BG) over the contiguous United States in October 2007. Note the scale change from (a) to (b) and (c).
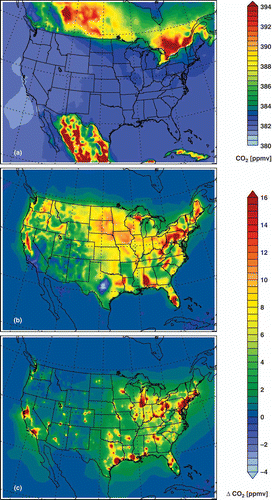
Figure 5. Monthly mean CO2 produced by (a) the background model (BG), (b) biospheric sources only in the United States (BIO-BG), and (c) fossil-fuel sources only in the U.S. (FF-BG) over the contiguous United States in October 2007. Note the scale change from (a) to (b) and (c).

Figure 6. Monthly mean CO2 concentrations near the surface simulated for October 2007 by (a) VCT (b) VCS, and (c) VCL.
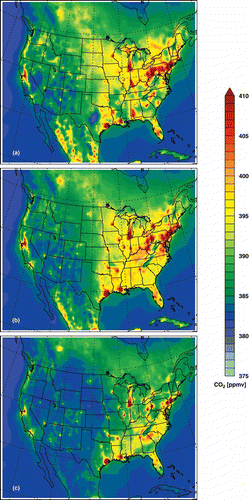
Figure 6. Monthly mean CO2 concentrations near the surface simulated for October 2007 by (a) VCT (b) VCS, and (c) VCL.
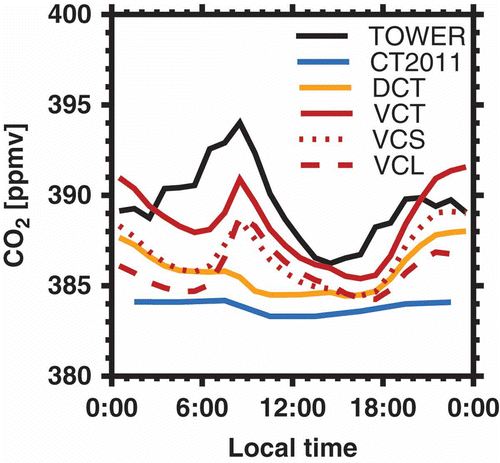
Figure 7. Monthly mean diurnal profiles of CO2 in October 2007 observed at Boulder Atmospheric Observatory (BAO) (TOWER) and simulated by CT2011 and CMAQ with different configurations, DCT, VCT, VCS, and VCL.

Figure 7. Monthly mean diurnal profiles of CO2 in October 2007 observed at Boulder Atmospheric Observatory (BAO) (TOWER) and simulated by CT2011 and CMAQ with different configurations, DCT, VCT, VCS, and VCL.

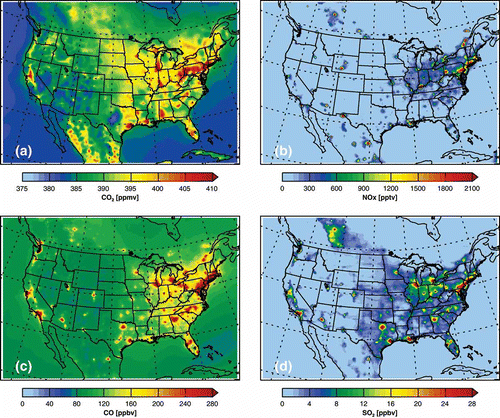
Figure 8. Monthly mean concentrations of (a) CO2, (b) NOx, (c) CO, and (d) SO2 near the surface simulated by CMAQ for October 2007. CO2 is simulated by VCT (our standard model).

Figure 8. Monthly mean concentrations of (a) CO2, (b) NOx, (c) CO, and (d) SO2 near the surface simulated by CMAQ for October 2007. CO2 is simulated by VCT (our standard model).
Supplemental material

Supplemental Material

Download MS Word (1.4 MB)

Reprints and Corporate Permissions

Please note: Selecting permissions does not provide access to the full text of the article, please see our help page How do I view content?

To request a reprint or corporate permissions for this article, please click on the relevant link below:

Academic Permissions

Please note: Selecting permissions does not provide access to the full text of the article, please see our help page How do I view content?

Obtain permissions instantly via Rightslink by clicking on the button below:

If you are unable to obtain permissions via Rightslink, please complete and submit this Permissions form. For more information, please visit our Permissions help page.