Figures & data
Figure 1. Framework of an integrated freight emission project.
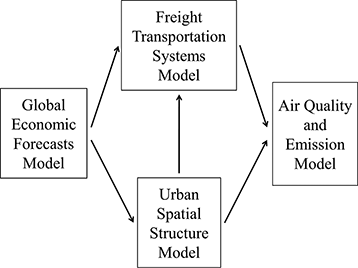
Figure 2. Maps of freight zones (adapted from Federal Highway Administration, U.S. Department of Transportation [2011] and Research and Innovative Technology Administration, U.S. Department of Transportation [2011]): (a) FAF3 analysis zones and (b) national transportation analysis regions (1993 CFS).
![Figure 2. Maps of freight zones (adapted from Federal Highway Administration, U.S. Department of Transportation [2011] and Research and Innovative Technology Administration, U.S. Department of Transportation [2011]): (a) FAF3 analysis zones and (b) national transportation analysis regions (1993 CFS).](/cms/asset/2ffa41f1-5976-4d38-b955-47ba98a86072/uawm_a_831799_o_f0002g.gif)
Table 1. Data statistics by mode and commodity type (4 years total)
Figure 3. Total tonnage and freight value per ton in 4 years: (a) total freight tonnage increasing rate and (b) freight value per ton.
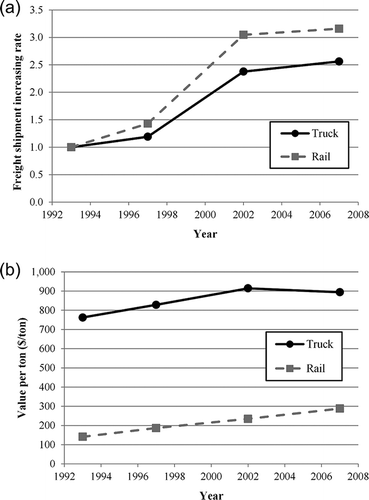
Figure 4. Cumulative percentage of (a) total tons and (b) ton-miles shipped.
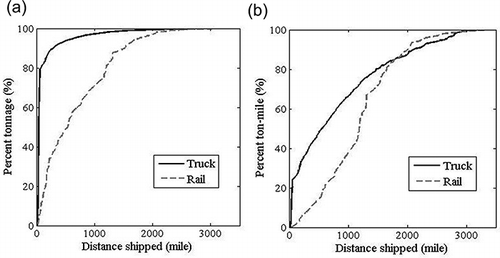
Table 2. Estimation results and goodness of fit
Table 3. Comparison between observed and predicted total truck shares and paired comparison
Figure 5. Observed and predicted truck shipment shares for (a) type 6 and (b) type 8 commodities.
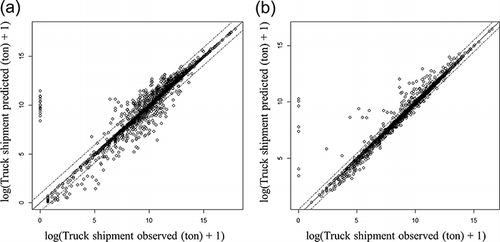
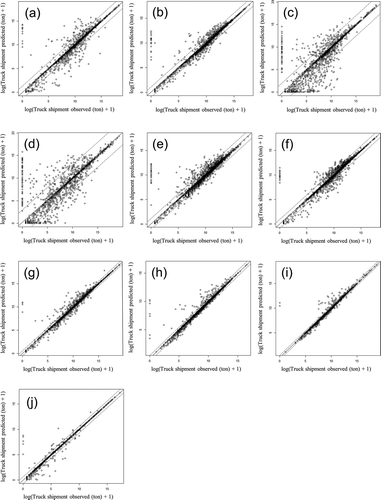
Figure A1. Observed and predicted truck shipment shares for all commodity types: (a) commodity type 1, (b) commodity type 2, (c) commodity type 3, (d) commodity type 4, (e) commodity type 5, (f) commodity type 6, (g) commodity type 7, (h) commodity type 8, (i) commodity type 9, and (j) commodity type 10.