Figures & data
Figure 1. Annual CO2 emissions measured by CEMS (CAMD data) vary by ±10.8% (two times the standard deviation) from CO2 emissions calculated from fuel consumption (EIA data) for 210 U.S. coal-fired power plants during 2009. The percent difference was calculated according to: 100 × (CAMD – EIA)/[(CAMD + EIA)/2].
![Figure 1. Annual CO2 emissions measured by CEMS (CAMD data) vary by ±10.8% (two times the standard deviation) from CO2 emissions calculated from fuel consumption (EIA data) for 210 U.S. coal-fired power plants during 2009. The percent difference was calculated according to: 100 × (CAMD – EIA)/[(CAMD + EIA)/2].](/cms/asset/0a4e4976-40aa-4135-873f-b3af6434d71a/uawm_a_833146_o_f0001g.gif)
Figure 2. Annual CO2 emission rates calculated from CAMD and EIA data for 210 U.S. power plants during 2009 show similar mean values (2,062 and 2,074 lb CO2/MWh, respectively), but more variable CAMD emission rates compared to EIA emission rates (standard deviations of 178 and 137 lb CO2/MWh, respectively).
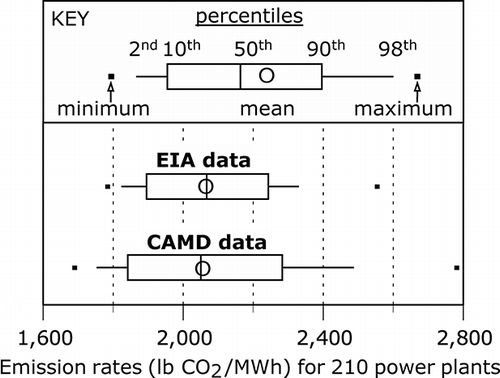
Figure 3. Attenuation bias due to CAMD measurement error is shown by comparison of best-fit lines where (a) EIA CO2 emission rates are used to predict CAMD rates, and (b) CAMD CO2 emission rates are used to predict EIA rates (data are for 210 U.S. coal-fired power plants during 2009). Although both lines share the same significance and correlation (P < 0.001, R 2 = 0.61), note the larger standard error for (a) and that the slope for (b) is closer to zero.
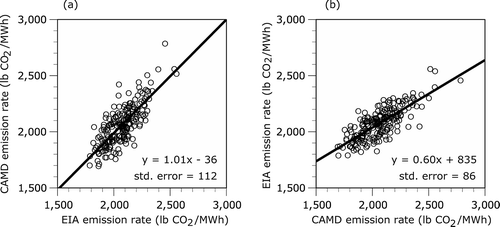
Table 1. EPA methods used to measure and certify flue-gas flow. Results from the installed measurement system must agree with results from one or more of these methods
Table 2. The difference between CAMD and EIA CO2 emissions varied with the method used to certify the CAMD flue-gas flow measurement at 112 power plants during 2009
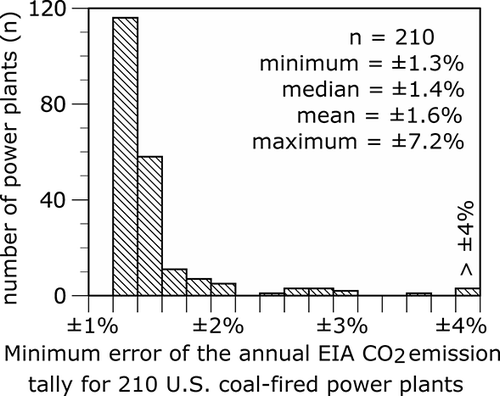
Figure 4. The minimum error of the annual CO2 emission tally calculated from the EIA fuel consumption data varies between ±1.3% and ±7.2% for 210 U.S. coal-fired power plants during 2009.