Figures & data
Figure 1. The air pollution monitoring station (37-063-0015) at the Durham National Guard Armory.
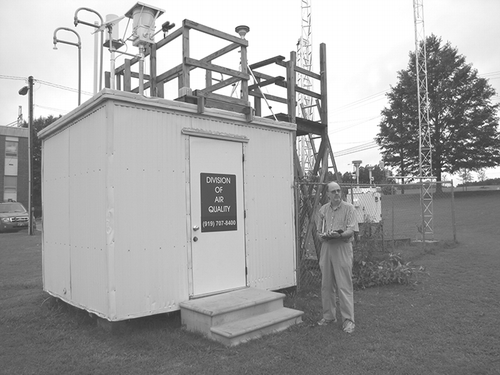
Figure 2. Cart in operating mode.
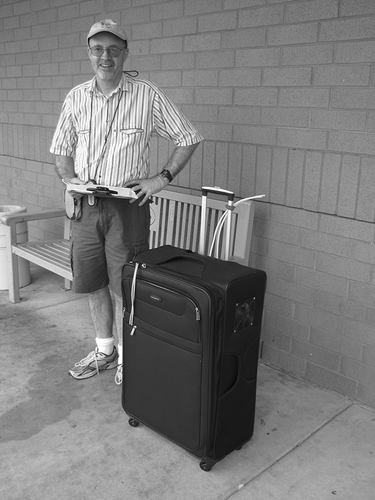
Figure 3. Time-series plot of 1-min average Durham Armory Thermo 49C, 2B Techologies 205, and 2B Technologies 211 microenvironmental ozone concentrations (ppb) illustrating sequential visits to a car repair garage office (10:00 a.m.), an urban park restroom facility (11:00 a.m.), an outdoor location next to the outdoor Armory fixed-site monitor (11:15 a.m.), a fast-food restaurant during lunch (12:15 p.m.), a guitar and violin repair shop (1:15 p.m.), an art and frame shop (2:00 p.m.), a book store (3:15 p.m.), a record shop (4:00 p.m.), a pizzeria during dinner (5:00 p.m.), an ice cream shop (6:15 p.m.), a residence, indoors (7:15 p.m.), and a residence, outdoors (7:30 p.m.).
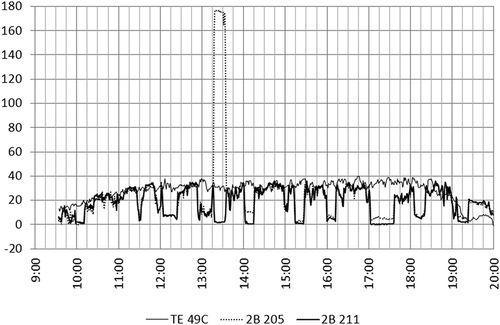
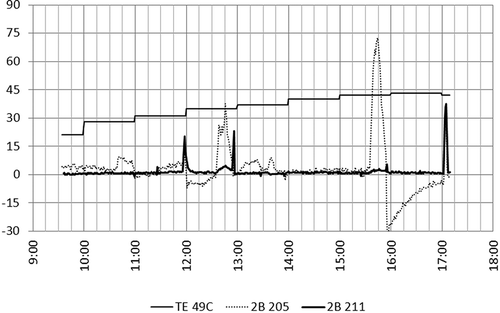
Figure 4. Illustrative time-series plots of 1-hr average Durham Armory Thermo 49C, 1-min average 2B Tech 205, and 1-min 211 ozone concentrations (ppb) measured during household activities that included toasting and grinding spices during lunch preparation in kitchen (10:45 a.m.), cooking lunch on the kitchen gas stove (11:45 a.m.), briefly sampling outdoor air passing to (12:00 p.m.) and from (12:55 p.m.) test vehicle cabin outside the residence, sampling closed test vehicle cabin before and after installing an air freshener (12:30 and 12:45 p.m.), washing lunch cooking and dining utensils in the kitchen dish washer (1:15 p.m.), shampooing hair during a bathroom shower (1:40 p.m.), mopping the bathroom floor with a disinfectant cleaner (3:45 p.m.), and briefly sampling the ambient air outside the residence (5:05 p.m.).