822
Views
2
CrossRef citations to date
0
Altmetric
Technical Papers

Comparative statistical study of hourly precipitation determined by radar-based Stage IV and ground-based methods in the North Central United States

, , , , &

Figures & data

Figure 1. Spatial distribution of HADS stations, NEXRAD radar stations, and selected precipitation stations.
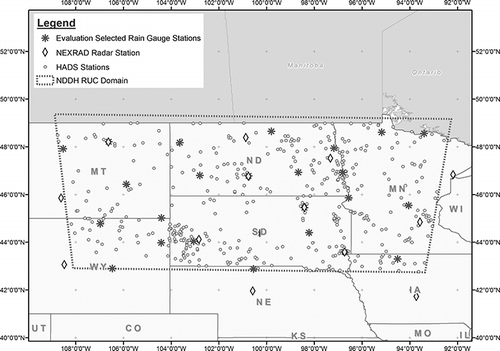
Figure 1. Spatial distribution of HADS stations, NEXRAD radar stations, and selected precipitation stations.

Table 1. Selected rain gauge precipitation stations for the comparative analyses

Table 2. Location and distance of nearest NEXRAD radar site to rain gauge stations

Figure 2. Number of hours of nonzero precipitation, 2006–2008.

Figure 2. Number of hours of nonzero precipitation, 2006–2008.

Figure 3. Ratios of hours of precipitation in 2006–2008.

Figure 3. Ratios of hours of precipitation in 2006–2008.

Figure 4. Mean bias (Stage IV − rain gauge), in/hr.

Figure 4. Mean bias (Stage IV − rain gauge), in/hr.

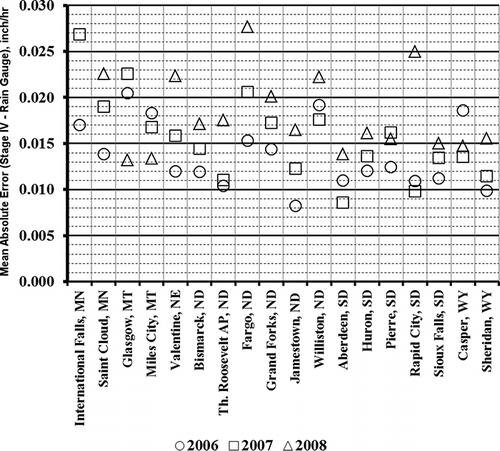
Figure 5. Mean absolute error (Stage IV − rain gauge), in/hr.

Figure 5. Mean absolute error (Stage IV − rain gauge), in/hr.

Figure 6. Total annual Stage IV precipitation as a function of total annual rain gauge precipitation.
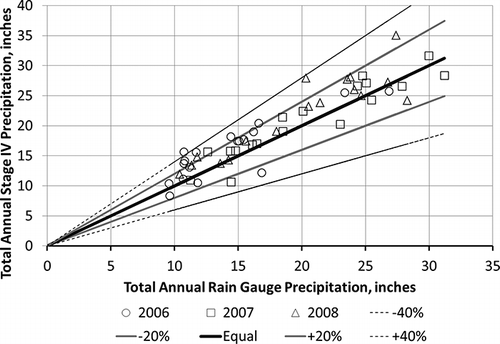
Figure 6. Total annual Stage IV precipitation as a function of total annual rain gauge precipitation.

Figure 7. Intercept and slope of linear regression of Stage IV precipitation as function of rain gauge precipitation.
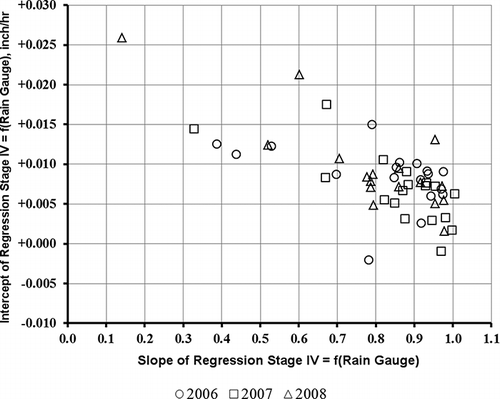
Figure 7. Intercept and slope of linear regression of Stage IV precipitation as function of rain gauge precipitation.

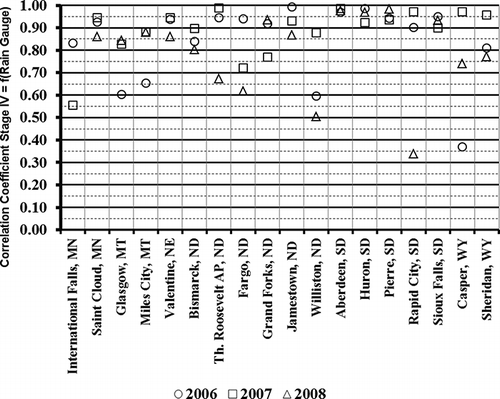
Figure 8. Correlation coefficient Stage IV as a function of rain gauge data.

Figure 8. Correlation coefficient Stage IV as a function of rain gauge data.

Figure 9. Scatter plot of hourly Stage IV precipitation as a function of hourly rain gauge precipitation: Jamestown, ND, in 2006.
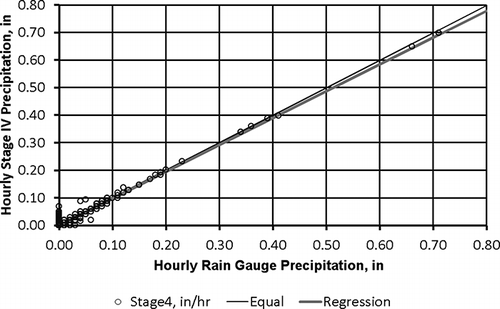
Figure 9. Scatter plot of hourly Stage IV precipitation as a function of hourly rain gauge precipitation: Jamestown, ND, in 2006.

Figure 10. Scatter plot of hourly Stage IV precipitation as a function of hourly rain gauge precipitation: Sioux Falls, SD, in 2006.
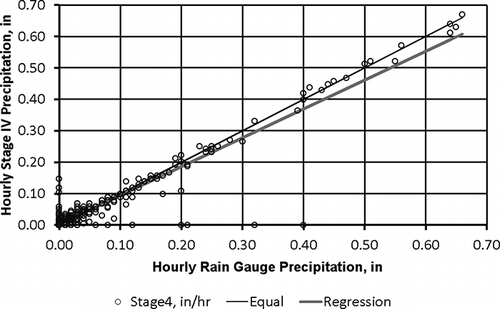
Figure 10. Scatter plot of hourly Stage IV precipitation as a function of hourly rain gauge precipitation: Sioux Falls, SD, in 2006.

Figure 11. Scatter plot of hourly Stage IV precipitation as a function of hourly rain gauge precipitation: Bismark, ND, in 2006.
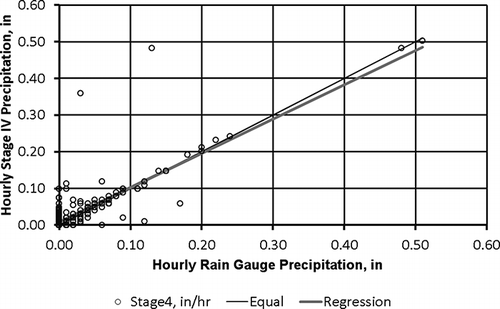
Figure 11. Scatter plot of hourly Stage IV precipitation as a function of hourly rain gauge precipitation: Bismark, ND, in 2006.

Figure 12. Scatter plot of hourly Stage IV precipitation as a function of hourly rain gauge precipitation: Casper, WY, in 2006.
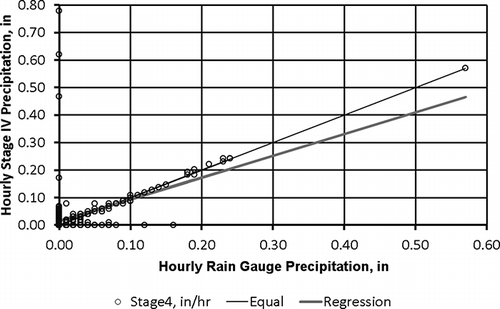
Figure 12. Scatter plot of hourly Stage IV precipitation as a function of hourly rain gauge precipitation: Casper, WY, in 2006.

Figure 13. Scatter plot of hourly Stage IV precipitation as a function of hourly rain gauge precipitation: Ringsted, IA, in 2006.
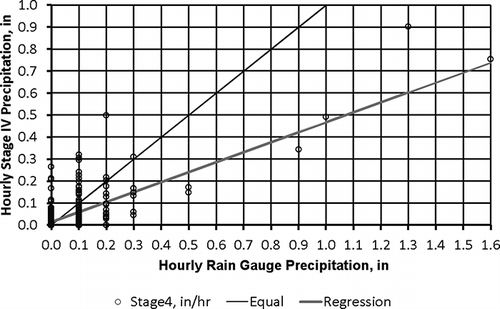
Figure 13. Scatter plot of hourly Stage IV precipitation as a function of hourly rain gauge precipitation: Ringsted, IA, in 2006.

Figure 14. Mean bias (Stage IV − rain gauge) for high-precision stations as a function of rain gauge type.
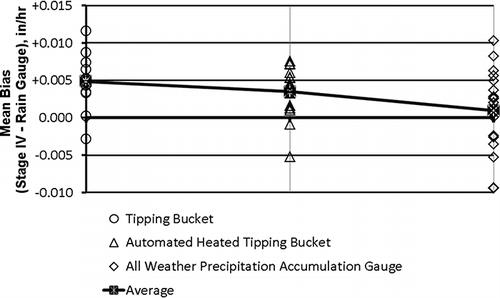
Figure 14. Mean bias (Stage IV − rain gauge) for high-precision stations as a function of rain gauge type.

Figure 15. Mean absolute error (Stage IV − rain gauge) for high-precision stations as a function of rain gauge type.
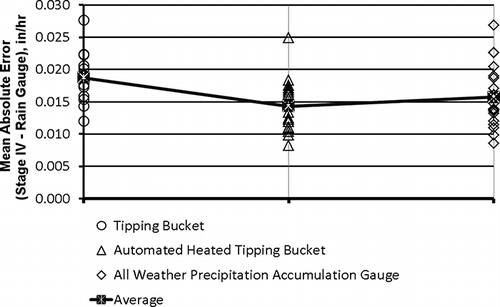
Figure 15. Mean absolute error (Stage IV − rain gauge) for high-precision stations as a function of rain gauge type.

Figure 16. Correlation coefficient, Stage IV, as a function of rain gauge data for high-precision stations categorized by rain gauge type.
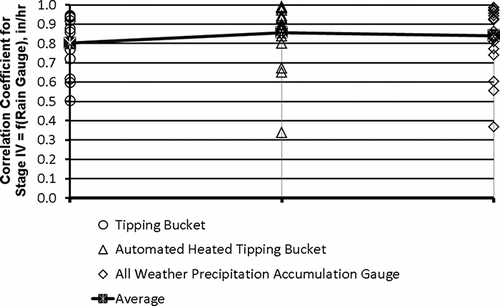
Figure 16. Correlation coefficient, Stage IV, as a function of rain gauge data for high-precision stations categorized by rain gauge type.

Figure 17. Mean bias of Stage IV − rain gauge precipitation (in/hr) for high-precision stations as a function of distance from NEXRAD radar.
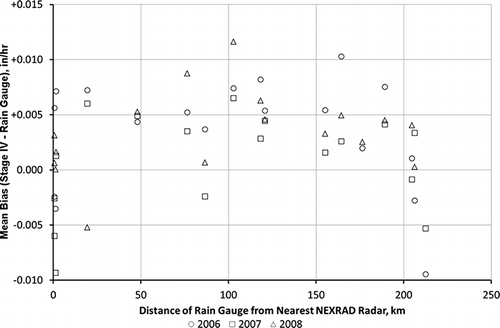
Figure 17. Mean bias of Stage IV − rain gauge precipitation (in/hr) for high-precision stations as a function of distance from NEXRAD radar.
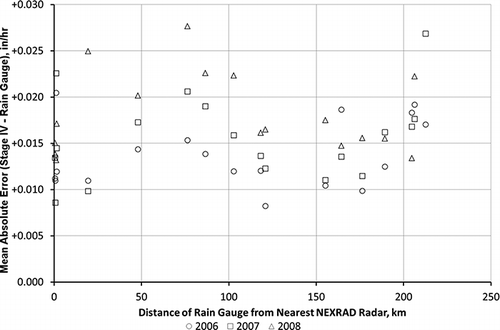
Figure 18. Mean absolute error of Stage IV − rain gauge precipitation (in/hr) for high-precision stations as a function of distance from NEXRAD radar.

Figure 18. Mean absolute error of Stage IV − rain gauge precipitation (in/hr) for high-precision stations as a function of distance from NEXRAD radar.

Figure 19. Correlation coefficient of Stage IV as a function of rain gauge for high-precision stations shown in relation to distance from NEXRAD radar.
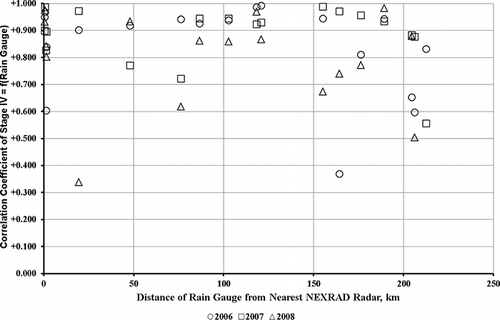
Figure 19. Correlation coefficient of Stage IV as a function of rain gauge for high-precision stations shown in relation to distance from NEXRAD radar.

Figure 20. Quarterly hours of nonzero precipitation by Stage IV and rain gauge in 2006 (high-precision stations).
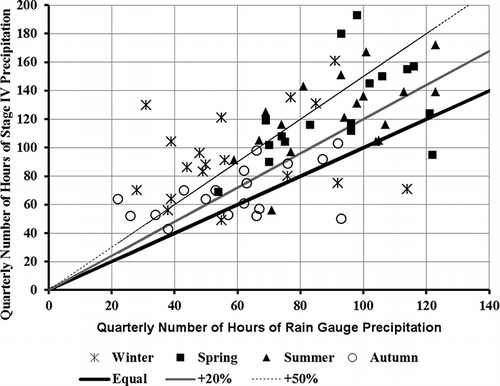
Figure 20. Quarterly hours of nonzero precipitation by Stage IV and rain gauge in 2006 (high-precision stations).

Figure 21. Quarterly Stage IV precipitation as a function of quarterly rain gauge precipitation in 2006.
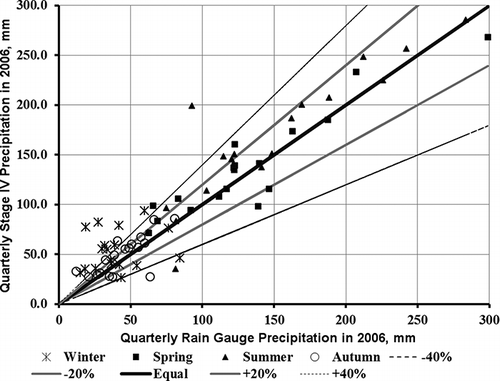
Figure 21. Quarterly Stage IV precipitation as a function of quarterly rain gauge precipitation in 2006.

Figure 22. Geographical distribution of total annual precipitation (mm) in 2007 (18 high-precision rain gauge stations).
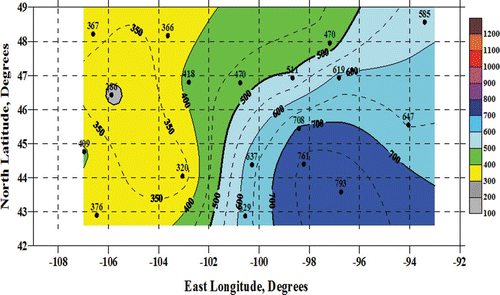
Figure 22. Geographical distribution of total annual precipitation (mm) in 2007 (18 high-precision rain gauge stations).

Figure 23. Geographical distribution of total annual precipitation (mm) in 2007 Stage IV, at 25 selected rain gauge stations.
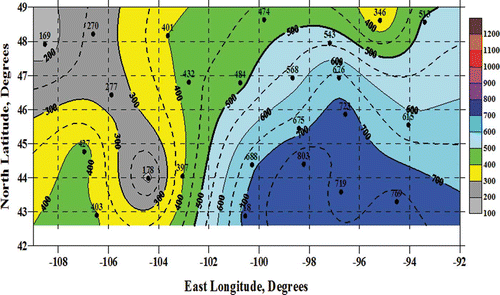
Figure 23. Geographical distribution of total annual precipitation (mm) in 2007 Stage IV, at 25 selected rain gauge stations.

Figure 24. Geographical distribution of total annual precipitation (mm) in 2007 Stage IV: 52,011 grid points, 4 km × 4 km spatial resolution.
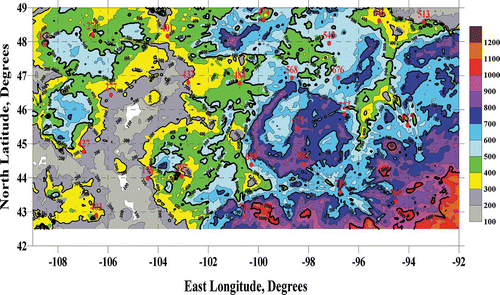
Figure 24. Geographical distribution of total annual precipitation (mm) in 2007 Stage IV: 52,011 grid points, 4 km × 4 km spatial resolution.

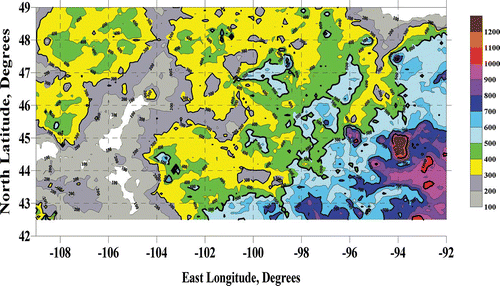
Figure 25. Geographical distribution of total annual precipitation (mm) in 2006 Stage IV: 52,011 grid points, 4 km × 4 km spatial resolution.
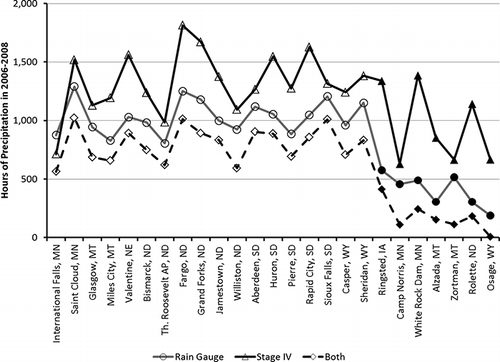
Figure 25. Geographical distribution of total annual precipitation (mm) in 2006 Stage IV: 52,011 grid points, 4 km × 4 km spatial resolution.
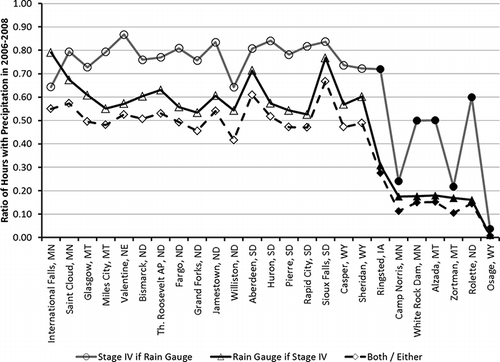
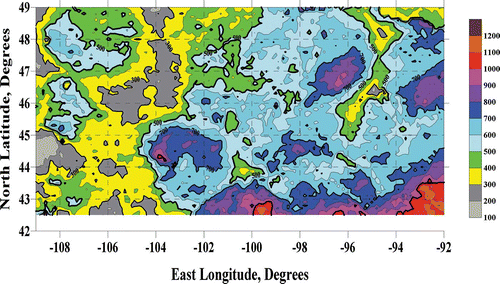
Figure 26. Geographical distribution of total annual precipitation (mm) in 2008 Stage IV: 52,011 grid points, 4 km × 4 km spatial resolution.
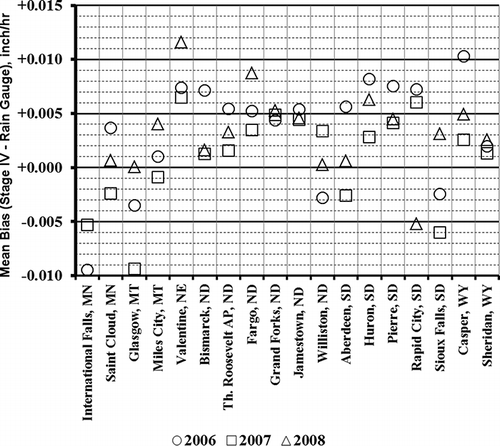
Figure 26. Geographical distribution of total annual precipitation (mm) in 2008 Stage IV: 52,011 grid points, 4 km × 4 km spatial resolution.
Reprints and Corporate Permissions

Please note: Selecting permissions does not provide access to the full text of the article, please see our help page How do I view content?

To request a reprint or corporate permissions for this article, please click on the relevant link below:

Academic Permissions

Please note: Selecting permissions does not provide access to the full text of the article, please see our help page How do I view content?

Obtain permissions instantly via Rightslink by clicking on the button below:

If you are unable to obtain permissions via Rightslink, please complete and submit this Permissions form. For more information, please visit our Permissions help page.