Figures & data
Figure 1. Schematic figure of AIM-IC. PPWD = parallel-plate wet denuder; PPSC = particle supersaturation chamber.
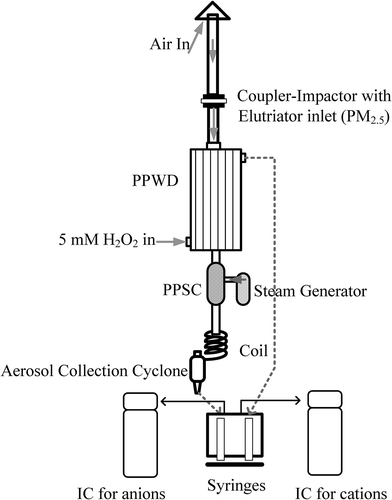
Figure 2. Map of sampling locations in Alberta, Canada (http://en.wikipedia.org/wiki/File:Athabasca_Oil_Sands_map.png).
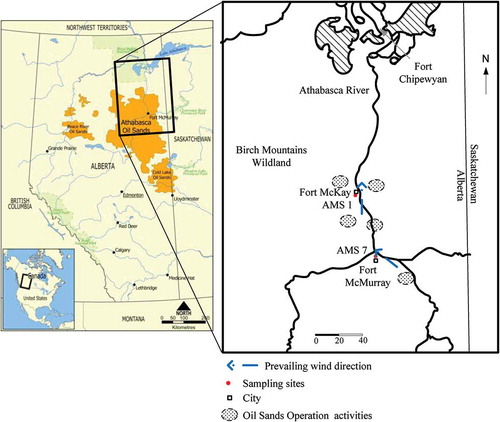
Figure 3. The time responses of the WBEA’s AIM-IC system to known concentrations of (a) SO2, (b) HNO3, and (c) NH3. The y-axes represent known concentrations of each chemical species delivered to the instrument from permeation sources each hour.
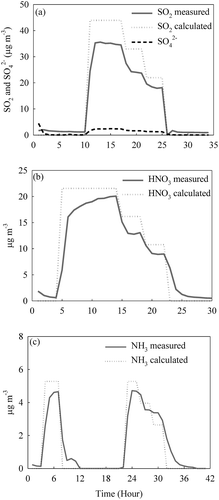
Figure 4. Intercomparison between AIM-IC and ADSS measurements of (a) sulfate and (b) nitrate (r is the Spearman rank-order correlation coefficient) at AMS 1.
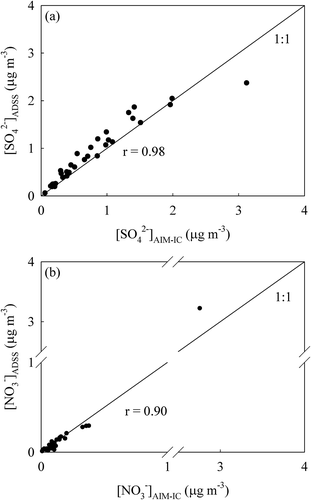
Figure 5. Intercomparison between WBEA‘s AIM-IC and FRM measurements of (a) sulfate, (b) nitrate, and (c) ammonium (r is the Spearman rank-order correlation coefficient) at AMS 7.
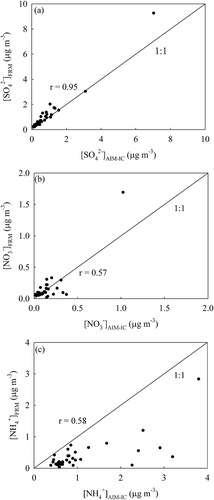
Figure 6. 2013 monthly mean and median concentrations (µg m−3) of NH3 and NH4+ at AMS 7. Filled circles indicate the 95th and 5th percentiles for NH4+ and open circles for NH3. The total sample hours were 370, 520, 553, 690, 566, 586, 632, 606, and 737 for NH3 and 335, 560, 554, 724, 567, 591, 639, 618, and 737 for NH4+ in April, May, June, July, August, September, October, November, and December, respectively.
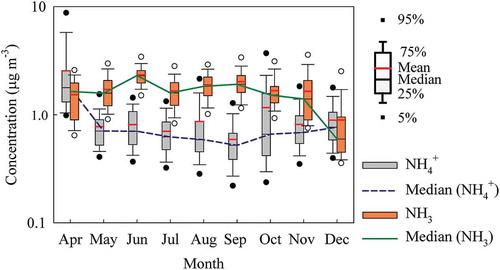
Figure 7. NH3 gas fraction from April to December 2013 at AMS 7. The NH3 gas fraction is defined as [NH3]/([NH3]+[NH4+]), molar fraction.
![Figure 7. NH3 gas fraction from April to December 2013 at AMS 7. The NH3 gas fraction is defined as [NH3]/([NH3]+[NH4+]), molar fraction.](/cms/asset/d24e39a5-5a82-49af-942f-d205b63f4e77/uawm_a_1001088_f0007_b.gif)
Table 1. Ambient NH3, SO2, and HNO3 concentration (µg m−3)
Figure 8. 2013 monthly mean and median concentrations (µg m−3) of SO2 and SO42− at AMS 7. Filled circles indicate the 95th and 5th percentiles for SO42− and open circles for SO2. The total sample hours were 370, 535, 553, 690, 562, 590, 631, 606, and 737 for SO2 and 346, 560, 553, 724, 560, 591, 633, 618, and 737 for SO42− in April, May, June, July, August, September, October, November, and December, respectively.
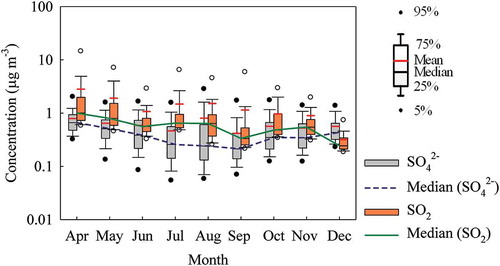
Figure 9. Hourly concentrations of SO42−, NH4+, and SO2 on July 21, 2013, at AMS 7. Aerosol neutralization ratio (ANR) is the mole equivalent concentration ratio of base (NH4+) to acids (SO42− and NO3−).
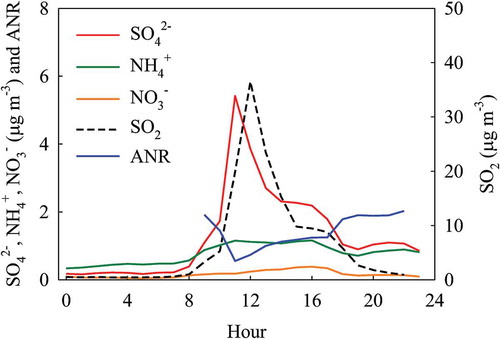
Figure 10. 2013 monthly mean and median concentrations (µg m−3) of HNO3 and NO3− at AMS 7. Filled circles indicate the 95th and 5th percentiles for NO3− and open circles for HNO3. The total sample hours were 370, 545, 553, 629, 562, 586, 631, 606, and 737 for HNO3 and 346, 560, 554, 724, 567, 591, 637, 618, and 736 for NO3− in April, May, June, July, August, September, October, November, and December, respectively.
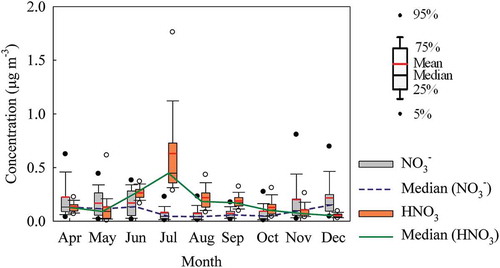
Figure 11. Diurnal profiles of HNO3, NO2, O3, and GSR in (a) June, (b) August, (c) October, and (d) December of 2013 at AMS 7.
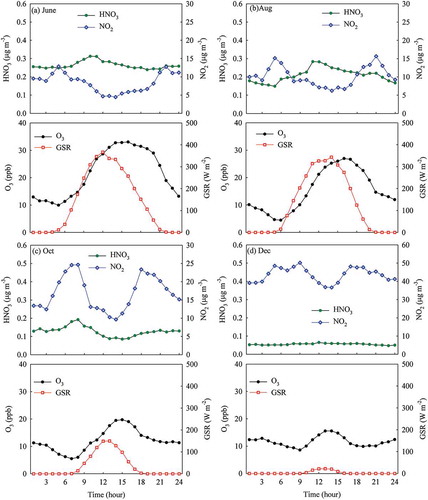
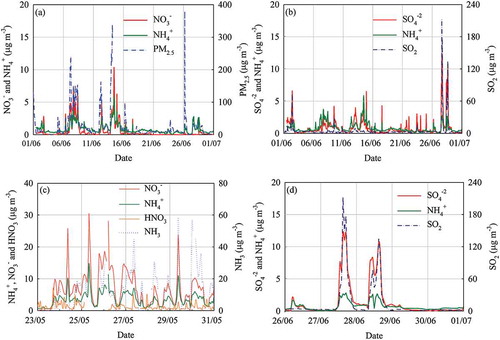
Figure 12. Hourly concentrations of NO3−, SO42−, NH4+, SO2, and total PM2.5 in June of 2011 at AMS 1.